












On November 12th, Bitcoin fell below $72,000. As the daily chart showed that the price slipped below the lower band of the Bollinger Bands, the weekly rebound also continued to collapse, losing another level of support.
According to the daily snapshot, Bitcoin trading is around $71,421, with a single-day decline of 3.50%.
Bitcoin has fallen below the 20-week and 50-week simple moving averages.
The liquidation heat map shows that there is still a large amount of leverage concentrated in the upper part of the market.
At the same time, the weekly capital flow is positive, which provides a contrast to the weak price structure.
According to the charts from Binance on TradingView, as of the time of publication, Bitcoin touched a low of $71,255 during the session and a high of $74,217. This decline brought Bitcoin below the $71,500 level; trader Jesse Olson had previously marked this level as a vulnerable spot that could lead to further weakness.
Olson posted on November 12th that Bitcoin had reached $71,500 and fallen below his third target level.
"A long-clearing cluster could accelerate this trend," he wrote.
This decline occurred after multiple attempts this week to regain stability failed. A one-week heat map of CoinGlass shows that before Bitcoin fell below $73,000 and then $72,000, it repeatedly formed lower rebound highs.
Bitcoin falls below the lower track of the daily Bollinger Bands
At $71,421, the trading price of Bitcoin was below the lower band of the daily Bollinger Bands, which is $71,978. The 20-day simple moving average, which constitutes the middle band, is at $77,338, indicating that the price is about 7.7% lower than this reference level.
Both the mid-track and the lower track are moving downward. Bitcoin's recent candlestick charts have been moving along the lower edge of the range, and the rebound since the summer low point has given way to a new round of selling.
A fall below the lower track may be accompanied by an extended decline, but the chart has not yet shown a sustained return to that range. If prices rebound above around $72,000, they will come close to that range again, while the downward 20-day moving average is still significantly higher.
The daily average trend index ( ADX ) is at 23.30 and has begun to rise. Combined with the falling prices, this reading indicates that the downward trend is strengthening. ADX itself measures the strength of the trend, rather than identifying the direction.
Earlier this week, crypto.news reported that inflation data triggered liquidations in the crypto market, with Bitcoin falling below $73,000. The U.S. Bureau of Labor Statistics released data for October showing that overall consumer prices rose by 0.4% that month, and core prices rose by 0.3%.
The weekly support level has been breached, and the average cost above $70,000 has become a reference point.
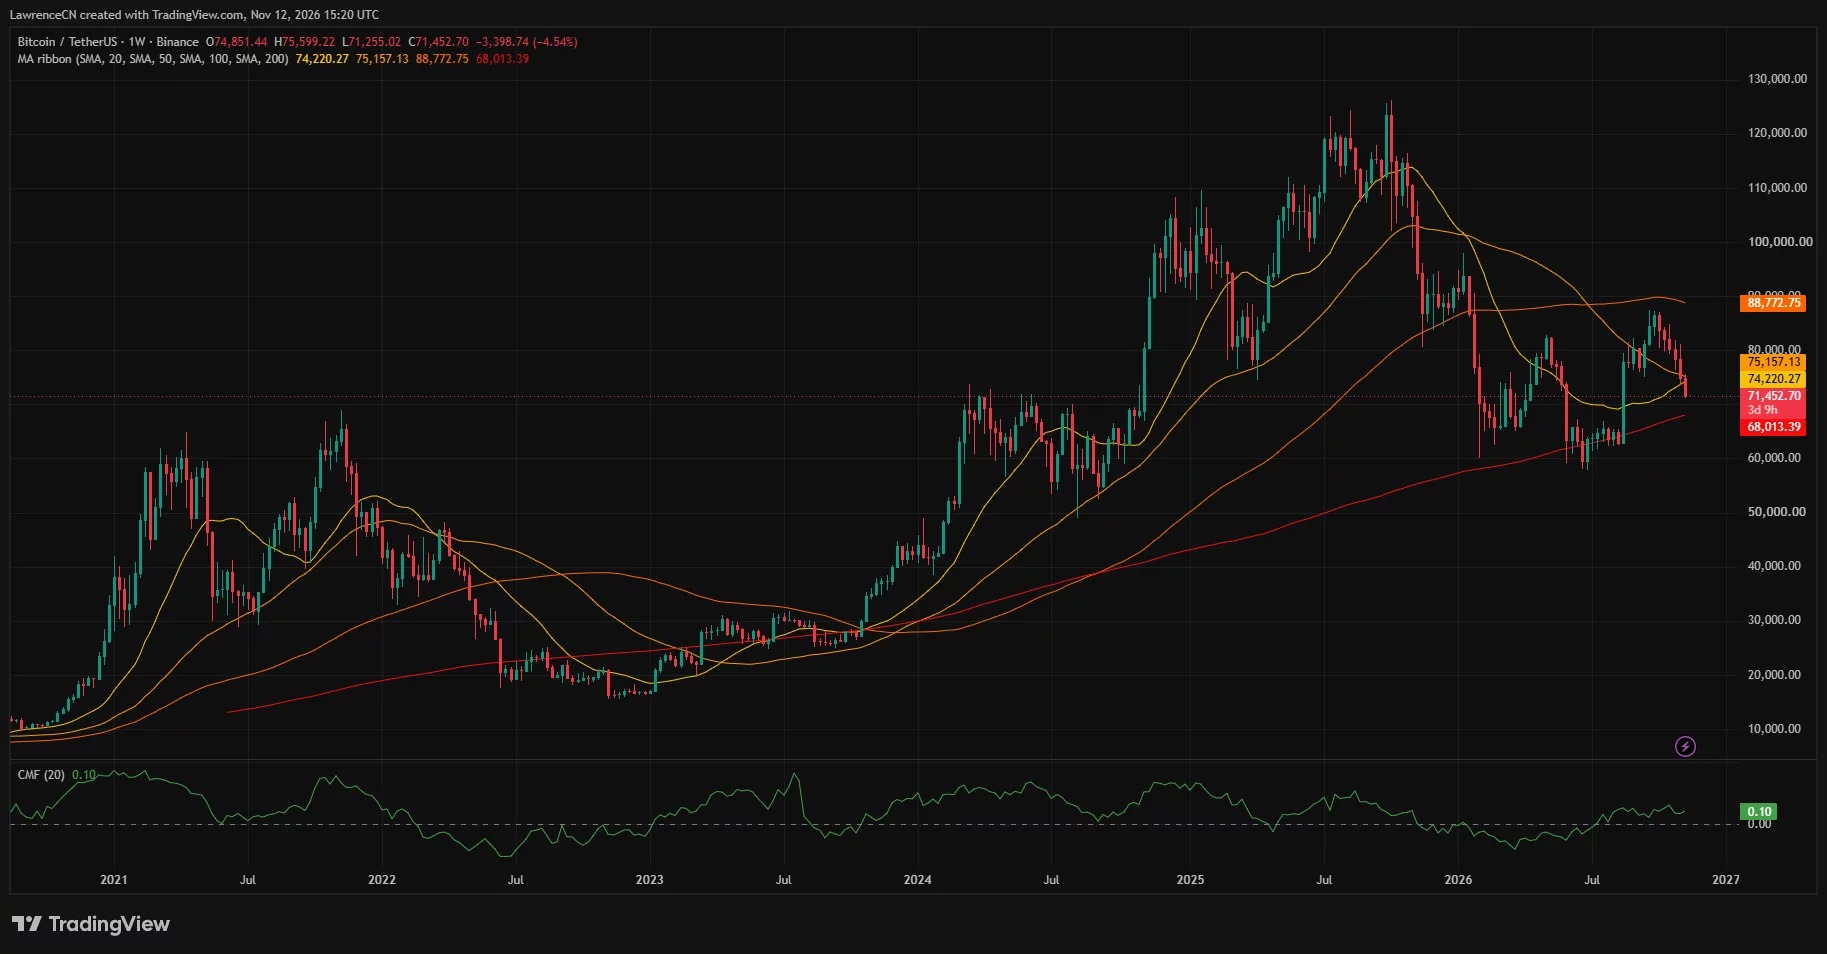
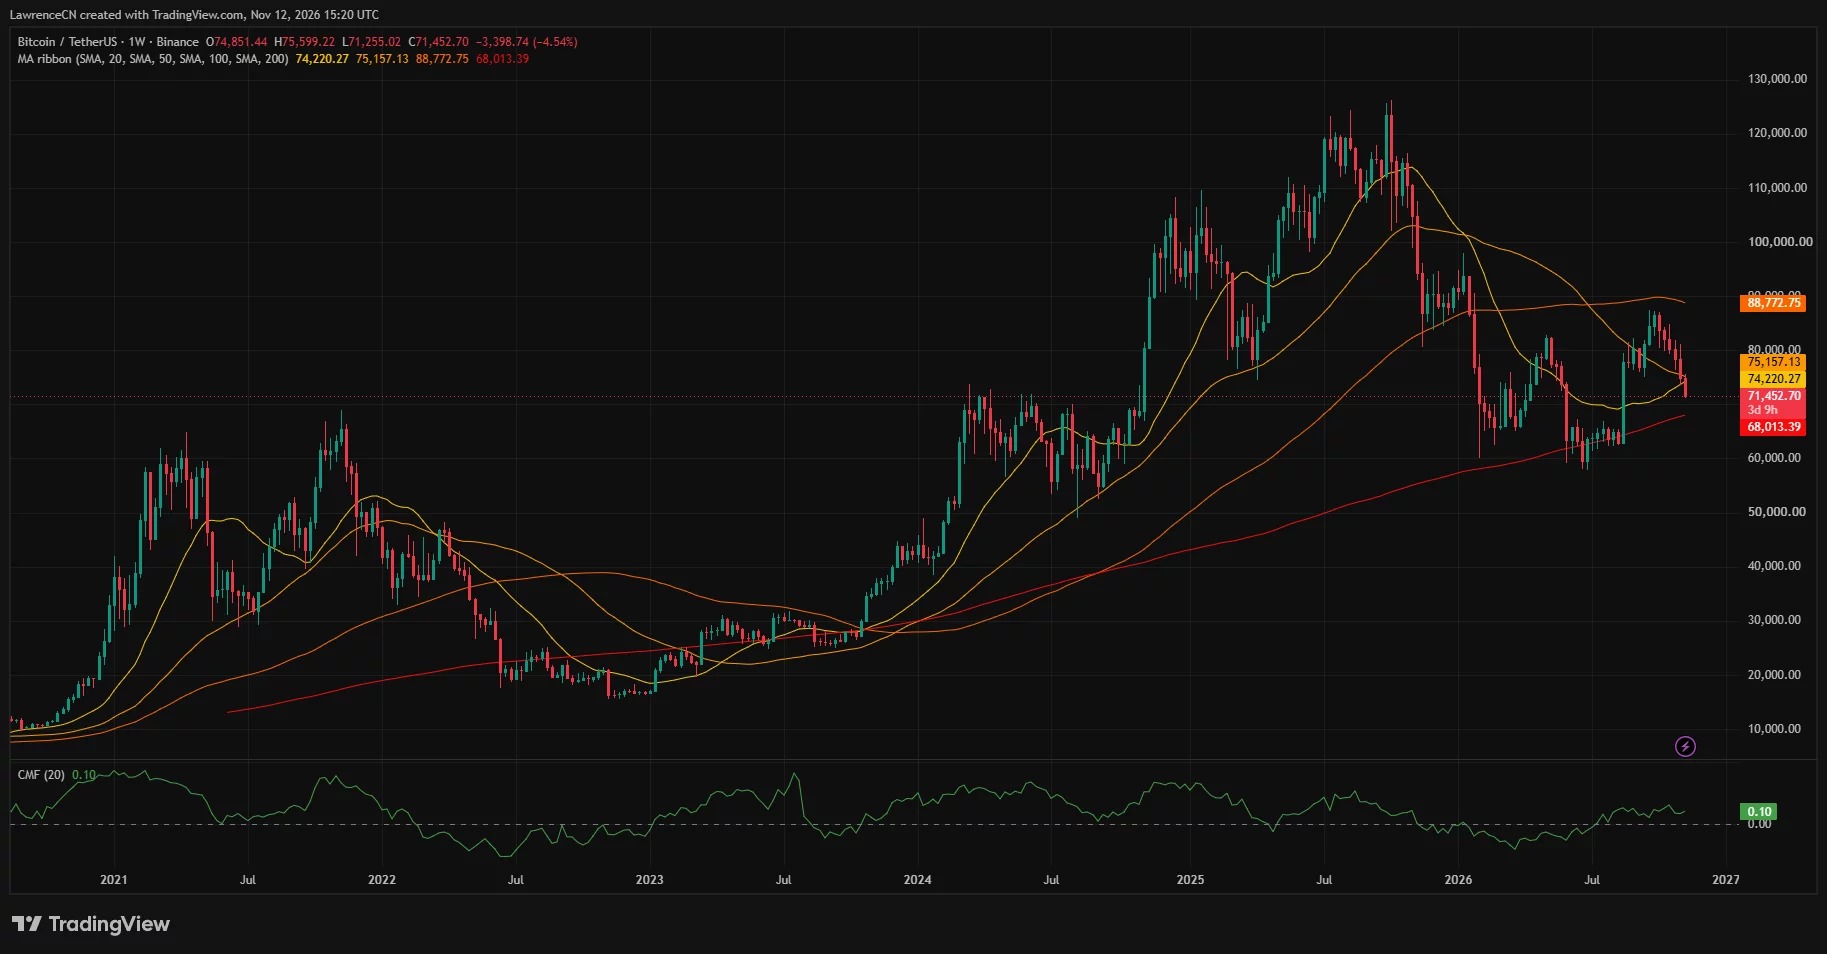
The weekly chart shows that Bitcoin is approaching $71,453, a decrease of 4.54% from this week's opening price. Its price is below the 20-week SMA of $74,220 and the 50-week SMA of $75,157; both of these moving averages could pose resistance during a rebound.
If we can regain the range of $74,200 to $75,200, it will reverse the situation of falling below these two moving averages. However, at the time of this snapshot, there are still more than three days left until the weekly candlestick chart closes, so the final closing price has not yet been determined.
Below, $70,000 is the most recent significant integer level, followed by the 200-week SMA of around $68,013. To reach the latter, the price would need to fall by approximately another 4.8% compared to the weekly snapshot price.
Despite the price decline, the weekly Chaikin capital flow remains at a positive value of 0.10. This reading indicates that there is still buying pressure during the period being reviewed by the indicator, sending a signal that is slightly less pessimistic than a breakdown of the moving average. However, this did not prevent Bitcoin from hitting a new intraweek low.
Leverage remains high, and traders are comparing this pullback to that of 2023.
CoinGlass Heatmap shows that there are still distinct clearing concentration areas around $76,300 to $76,700 and $77,300 to $77,600, with another visible area near $75,600. Below the latest prices, the clearing concentration areas become sparser and extend to around $70,000.
This heat map shows the positions where leveraged trades may face liquidation if prices touch these levels. The colored blocks represent estimated open positions, which are different from completed liquidations.
The persistent leverage has sparked concerns regarding Bitfinex Alpha during the market update on November 11. Analysts noted that from November 8 to November 11, the number of open futures contracts increased by 3.3%, while Bitcoin fell by 2.6%. They also pointed out that buying interest was weak, and over the eight trading days starting from October 30, there was a net outflow of $2.22 billion in US spot Bitcoin ETF.
Bitfinex has set the cost basis for short-term holders at $75,717, which is slightly above the weekly moving average resistance zone. According to their analysis, the 1.6 million BTC coins purchased in the range of $75,000 to $80,000 are currently in a floating loss position. This means that recent buyers may sell when the price approaches their purchase level.
Trader Daan Crypto Trades provided a historical comparison in a post on November 12th, likening this pullback to Bitcoin's first major retracement after the bear market recovery in 2023. His chart aligns previous banking crisis pullbacks with the current one, presenting a possible historical analogy rather than a confirmed reversal pattern.
"This callback was much slower than the previous one, but also more orderly," he wrote, noting that this proportional pullback was similar to previous events.
Disclosure: This article does not constitute investment advice. The content and materials on this page are for educational purposes only.