













Brief Overview
- Near Protocol ( NEAR ): Prices follow the broader market downward trend
- Stellar ( XLM ): Prices continue to be under pressure
- ChainLink ( LINK ): Price breaks below support
- Cardano ( ADA ): Price performance remains sluggish
Brief Overview
- Near Protocol ( NEAR ): The price is 3.385 US dollars, which has fallen below the orange moving average. A rebound is unlikely to occur before the 200-day exponential moving average approaches 3 US dollars.
- Stellar ( XLM ): The price has fallen to $0.14, and it will be difficult to recover unless there are catalysts in the broader market.
- ChainLink ( LINK ): The price has fallen below $10, currently at $9.89, with the next support level around $8.20.
- Cardano ( ADA ): The price has fallen below the $0.20 support level and is now testing $0.17; there is limited room for a rebound.
Near Protocol ( NEAR ): Prices follow the broader market downward trend
Near Protocol is simply following the broader market trend; one support level after another has been broken through, with no signs of recovery at all. NEAR is currently trading at around $3.385, and the recent decline has caused it to fall below the orange moving average.
From a technical perspective, it is almost unlikely to see signs of a rapid rebound before NEAR touches the 200-day moving average. On the chart, this long-term moving average is around $3, which could represent a potential recovery scenario.
From the perspective of price evolution, the only positive development so far is that it has once again crossed above the 200-day moving average in May. This moving average may become a support level at some point in the future, but that has not yet happened. Although it has lost its short-term support level, NEAR is still above this moving average.
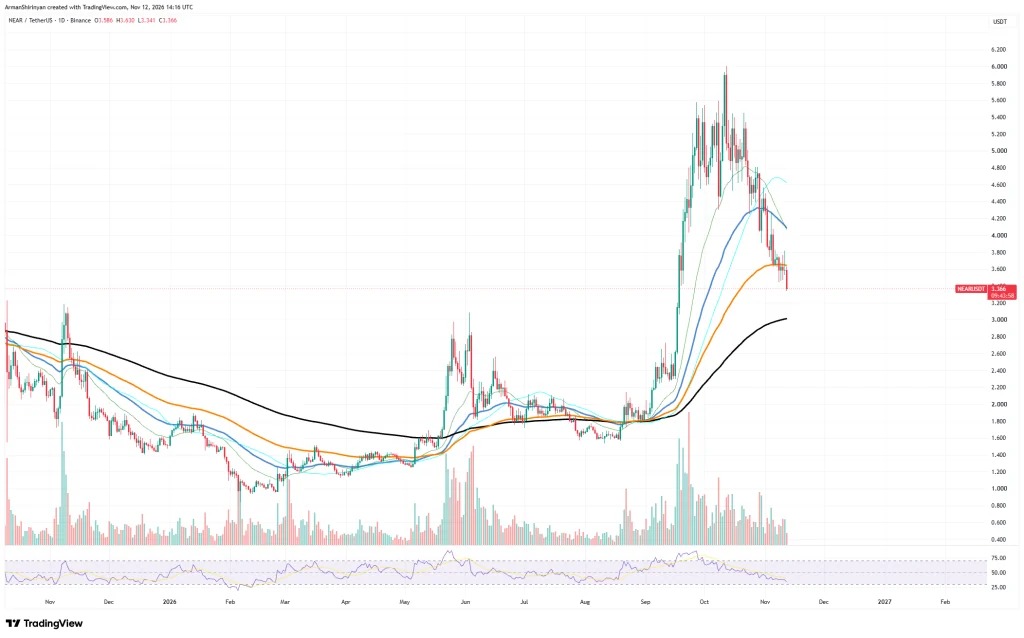
In September, this asset generally followed an upward trend, but due to the overall reversal in the cryptocurrency market, it then fell rapidly. Compared to the bullish reversal attempt by NEAR in October, this round of downward trend was much more pronounced.
In terms of trading volume, the current trend is downward, which leaves room for a potential recovery in the medium term.
RSI is also in a weak state and may soon enter an oversold region. This could lead to a rebound earlier than expected, but testing the aforementioned 200-day moving average index remains the main scenario. The mere occurrence of oversold readings does not guarantee a rebound.
Unfortunately, the current market situation is very tough, clearly showing strong pressure. A rebound from the long-term moving average would be a positive sign, but we can only confirm that the market has truly recovered when we see higher highs and sustained buying interest.
Stellar ( XLM ): Prices continue to be under pressure
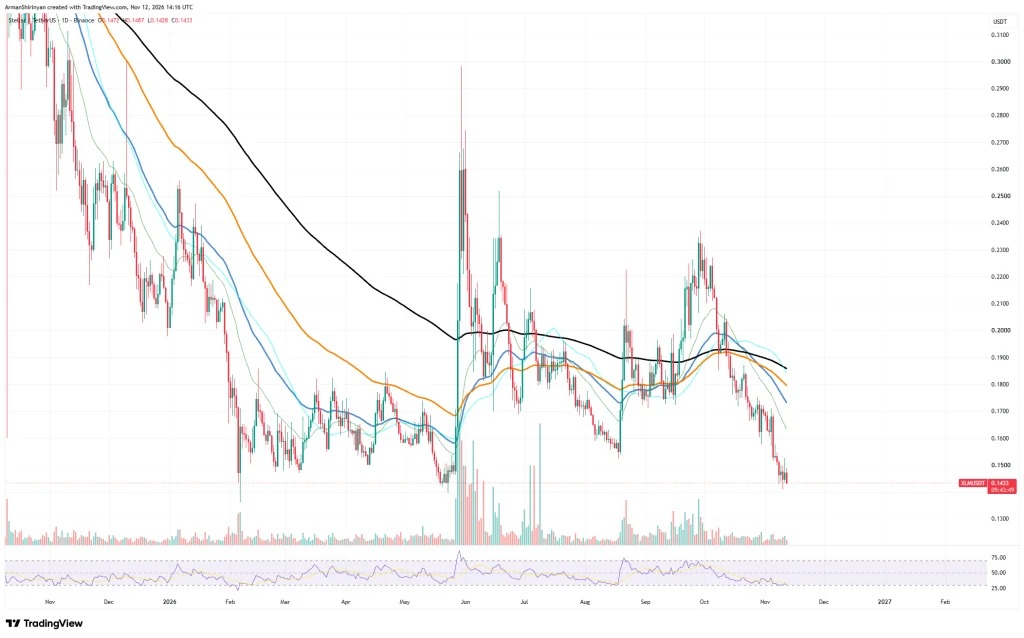
At the same time, prices have begun to show a similar trend, even falling below the range of the previously active buying zone; this zone appeared on August 18, 2026. Currently, the price is $0.14, which coincides with the previous accumulation point that was formed as early as May 2026.
The trend for RSI is also bearish, and we may not see a recovery until there are catalytic factors in the broader market. Although RSI is already in an oversold area, there are no strong catalysts to help it rebound quickly, and the moving averages have also begun to diverge.
This indicates that prices are likely to continue to fall. On the contrary, when the moving averages begin to converge, we should expect an increase in volatility; for that asset, this would be more positive than any other scenario.
ChainLink ( LINK ): Price breaks below support
Meanwhile, the difficulties faced by Chainlink in the market continue. The price has fallen below the 200-week moving average and is currently in a state of free fall. LINK is currently trading at around $9.89, and with the continuation of the downward trend, it has also lost support below the $10 level.
In this scenario, the next support level is around $8.20; if the price continues to fall below that, another potential support level is around $7. There have been earlier trading ranges between the current price and these levels, so the downward path is not necessarily clear. However, if the price drops to even lower levels, it would effectively negate all of the gains LINK has made since June.
Overall, the situation is not much different from that of other tokens. If you overlay charts such as Stellar, Chainlink, Ethereum, etc., you will see a similar pattern: after a rebound attempt, the price is once again under pressure.
The difference lies in the fact that LINK may experience additional spikes in volatility, which can quickly undermine the possibility of a rapid rebound, as the moving average has just begun to converge. If sellers continue to dominate, this trend will be particularly unfavorable. As the downward trend accelerates, the price decline could become even more severe.
Overall, it is currently very difficult to find any positive factors for LINK. Although RSI has approached the oversold zone, LINK may still continue to decline.
A recovery is unlikely to occur before there are catalytic factors in the broader market; higher highs and sustained buying interest are needed to indicate that the asset has finally begun to truly recover.
Cardano ( ADA ): Price performance remains sluggish
Although Cardano usually follows other cryptocurrency markets, the situation we observe here is similar to the previous three tokens. The asset has broken below the strong support level formed around $0.20 and is currently testing the potentially strong buying zone around $0.17.
In addition to that, Cardano has already fallen below the midpoint of the rebound from June to October. Although RSI shows an oversold condition, there is not much room for a rebound here.
On the positive side, trading volume has significantly decreased and has not provided additional momentum for the downward trend, which is a rather important advantage. We should also keep in mind that without bullish catalysts, it is unlikely to see a rapid recovery in the short term.
Compared to early November, trading volume has even increased slightly, which suggests that bears may still have enough strength to continue to push prices down. The moving average could converge again near the next support level, which might become the basis for a faster price rise. However, this cannot be guaranteed at present.
Overall, Cardano has been in a downward trend since 2025, so the brief upward movement from July to October should not be regarded as a reliable sign that the asset is recovering. Although the price did manage to cross above the 200-day moving average earlier on, this was not sufficient to sustain the rebound.
Cardano In the future, it may once again stand above this moving average and continue to rise, but this cannot be guaranteed either.
Success!