

Key Points
- Cardano ( ADA ) traded at around $0.171 on Friday, with the weekly decline expanding to nearly 4%.
- Since the beginning of October, ADA has fallen by more than 30%, reflecting ongoing selling pressure and weakening investor confidence.
- The immediate support level for ADA is at $0.156, the resistance level is at $0.183, and there is also a concentrated area for EMA between $0.203 and $0.229.
Cardano ( ADA ) continued to decline on Friday, trading at around $0.171. As derivative activity weakened and bearish signals on the chain increased, concerns about further declines in its price grew.
This cryptocurrency has fallen by nearly 4% this week, heading towards its sixth consecutive week of decline. Since the beginning of October, its price correction has wiped out more than 30% of its market value.
Derivatives traders' defensive stance is strengthening, with the long-short ratio of Cardano dropping to near its lowest level in over a month, and the funding rate has also turned negative.
Cardano Derivative signals are bearish, with the long-short ratio declining.
The derivatives market of Cardano continues to reflect weakening investor confidence, and traders are preparing for further declines.
According to CoinGlass data, the long-short ratio of ADA is 0.86, which is close to the lowest level in over a month.
A ratio lower than 1 indicates that there are more short positions than long positions under the measured indicator, suggesting that bearish positions have become more prominent.
The funding rates further confirm a weakening sentiment. The funding rate for Cardano turned negative on Thursday, and on Friday it was -0.0015%.
The combination of bearish positions and negative funding rates indicates that traders are still reluctant to bet that prices will continue to rebound.
The on-chain and trading indicators for Cardano also show that the market conditions remain unfavorable.
According to the aggregated data from CryptoQuant, both the spot and futures markets of ADA have seen large whale orders, while trading activity remains high.
The data also shows that the dominant position of sellers in both markets is quite evident. The indicators from CryptoQuant indicate that large market participants are still active, and aggressive selling pressure continues to outweigh buying pressure.
Cardano Price Outlook: ADA Remains Below Major Moving Averages
As this cryptocurrency continues to trade below the main daily moving average index (EMA), the technical outlook for Cardano remains bearish.
As of Friday's writing, ADA was trading at around $0.171, significantly lower than the 50-day EMA level of $0.203.
The 100-day EMA is at around $0.208, while the 200-day EMA is at around $0.229.
Trading below all three moving averages indicates that the seller still controls the short-term, medium-term, and long-term price trends.
The momentum indicator shows almost no signs of immediately turning bullish. The Relative Strength Index (RSI) on the daily chart ( RSI ) has dropped to around 29, bringing Cardano into an oversold zone.
Meanwhile, the Moving Average Convergence Divergence indicator ( MACD ) remains in the negative range, and its bar chart indicates limited momentum.
This indicates that although the speed of selling pressure may be stabilizing, bearish sentiment continues to prevail.
Overall, these indicators suggest that although there may be a short-term rebound, the broader downward trend of Cardano has not changed.
The next important support level for the downside is at $0.156. As traders assess whether this round of adjustment has been excessive, this level may attract buying interest.
If the support level of $0.156 can be effectively maintained, ADA may enter a consolidation phase and is expected to attempt a short-term rebound. However, if this support level is clearly broken through, the technical outlook will further deteriorate.
Although the technical structure is weak, if buyers manage to hold the $0.156 support level, Cardano may still attempt a rebound.
The first significant resistance level is at $0.183. If this level can be continuously broken through, it will indicate that the buying momentum in the short term is improving.
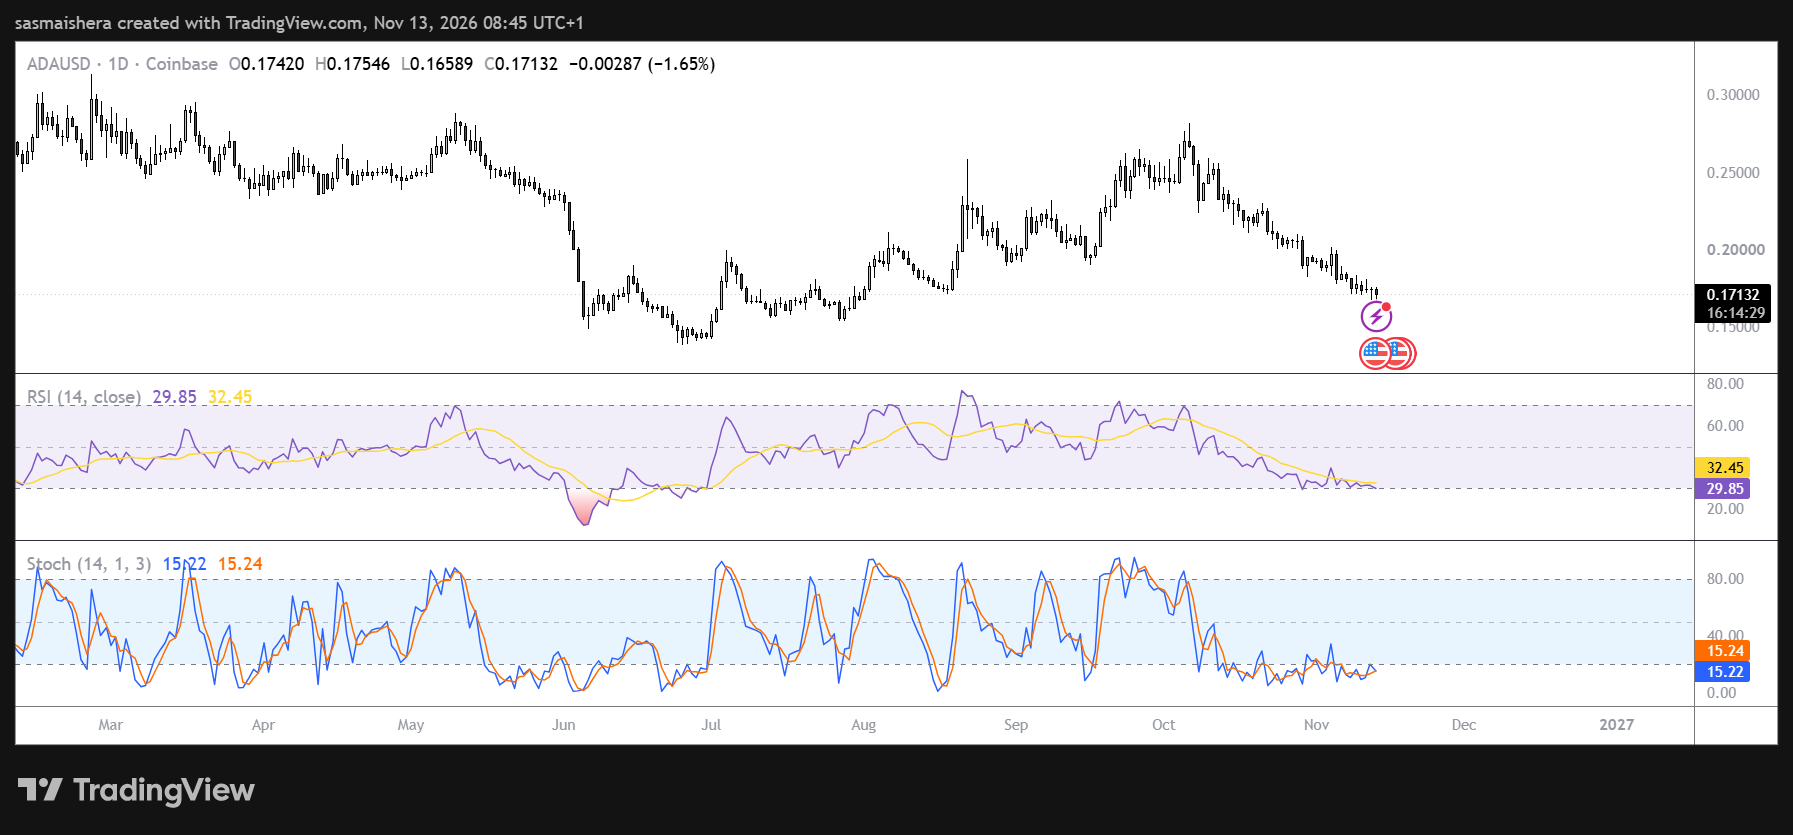
However, ADA will still face an important resistance range between $0.203 and $0.229, with the main daily line EMA concentrated in this area.
The $0.203 level for the 50-day EMA is the first major dynamic resistance. Above that, the 100-day EMA at around $0.208 and the 200-day EMA at approximately $0.229 could both limit further gains.
If it can re-cross these moving averages, it will more strongly indicate that the bearish structure of Cardano is improving. Further resistance levels are at $0.236, $0.245, and $0.296 respectively.