











WLFI recently saw a large withdrawal, while net outflows from exchanges continued, indicating that some funds are accumulating at lower prices. Although selling pressure has shown signs of easing, the price remains within a multi-month downward channel, and the trend has not yet reversed.
60.87 million coins were withdrawn in two days.
A newly identified major holder withdrew 60.87 million WLFI tokens from Binance in the past two days, estimated at approximately $3.55 million, with an average purchase price of about $0.058. This price is close to the current trading range, indicating that this fund did not enter at a high price but rather accumulated the funds continuously near the low price.
This transfer also reduced the number of tokens available for immediate sale on the exchange. While a single large transaction is usually insufficient to alter the overall trend, when increased holdings occur after prolonged price pressure, they are often seen by the market as a signal of rising risk appetite.
Net outflows from exchanges continue
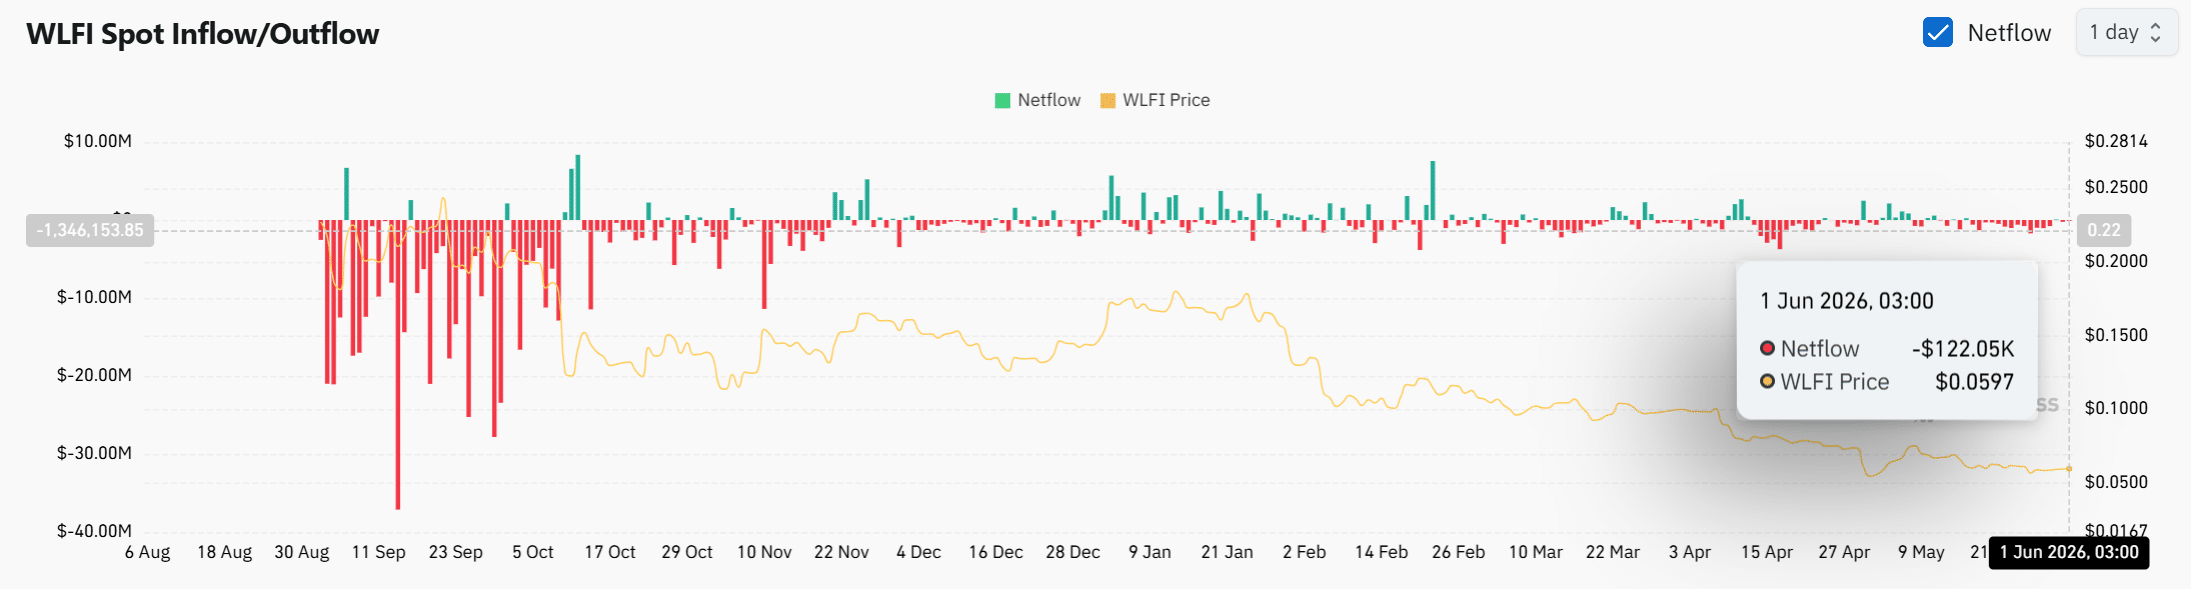
Aside from a single large holder increasing their holdings, WLFI also saw a continued net outflow from exchanges. Data shows that the token experienced a net outflow of approximately $122,000 in a single day, meaning that the amount of assets flowing out of exchanges exceeded the amount flowing in.
This trend has continued for several weeks, reflecting that some holders are more inclined to transfer tokens to private wallets rather than leave them on exchanges to sell. Although the scale of this net outflow is not extreme, its occurrence at the same time as whale withdrawals has increased market attention to supply contraction.
The support level has held for now.
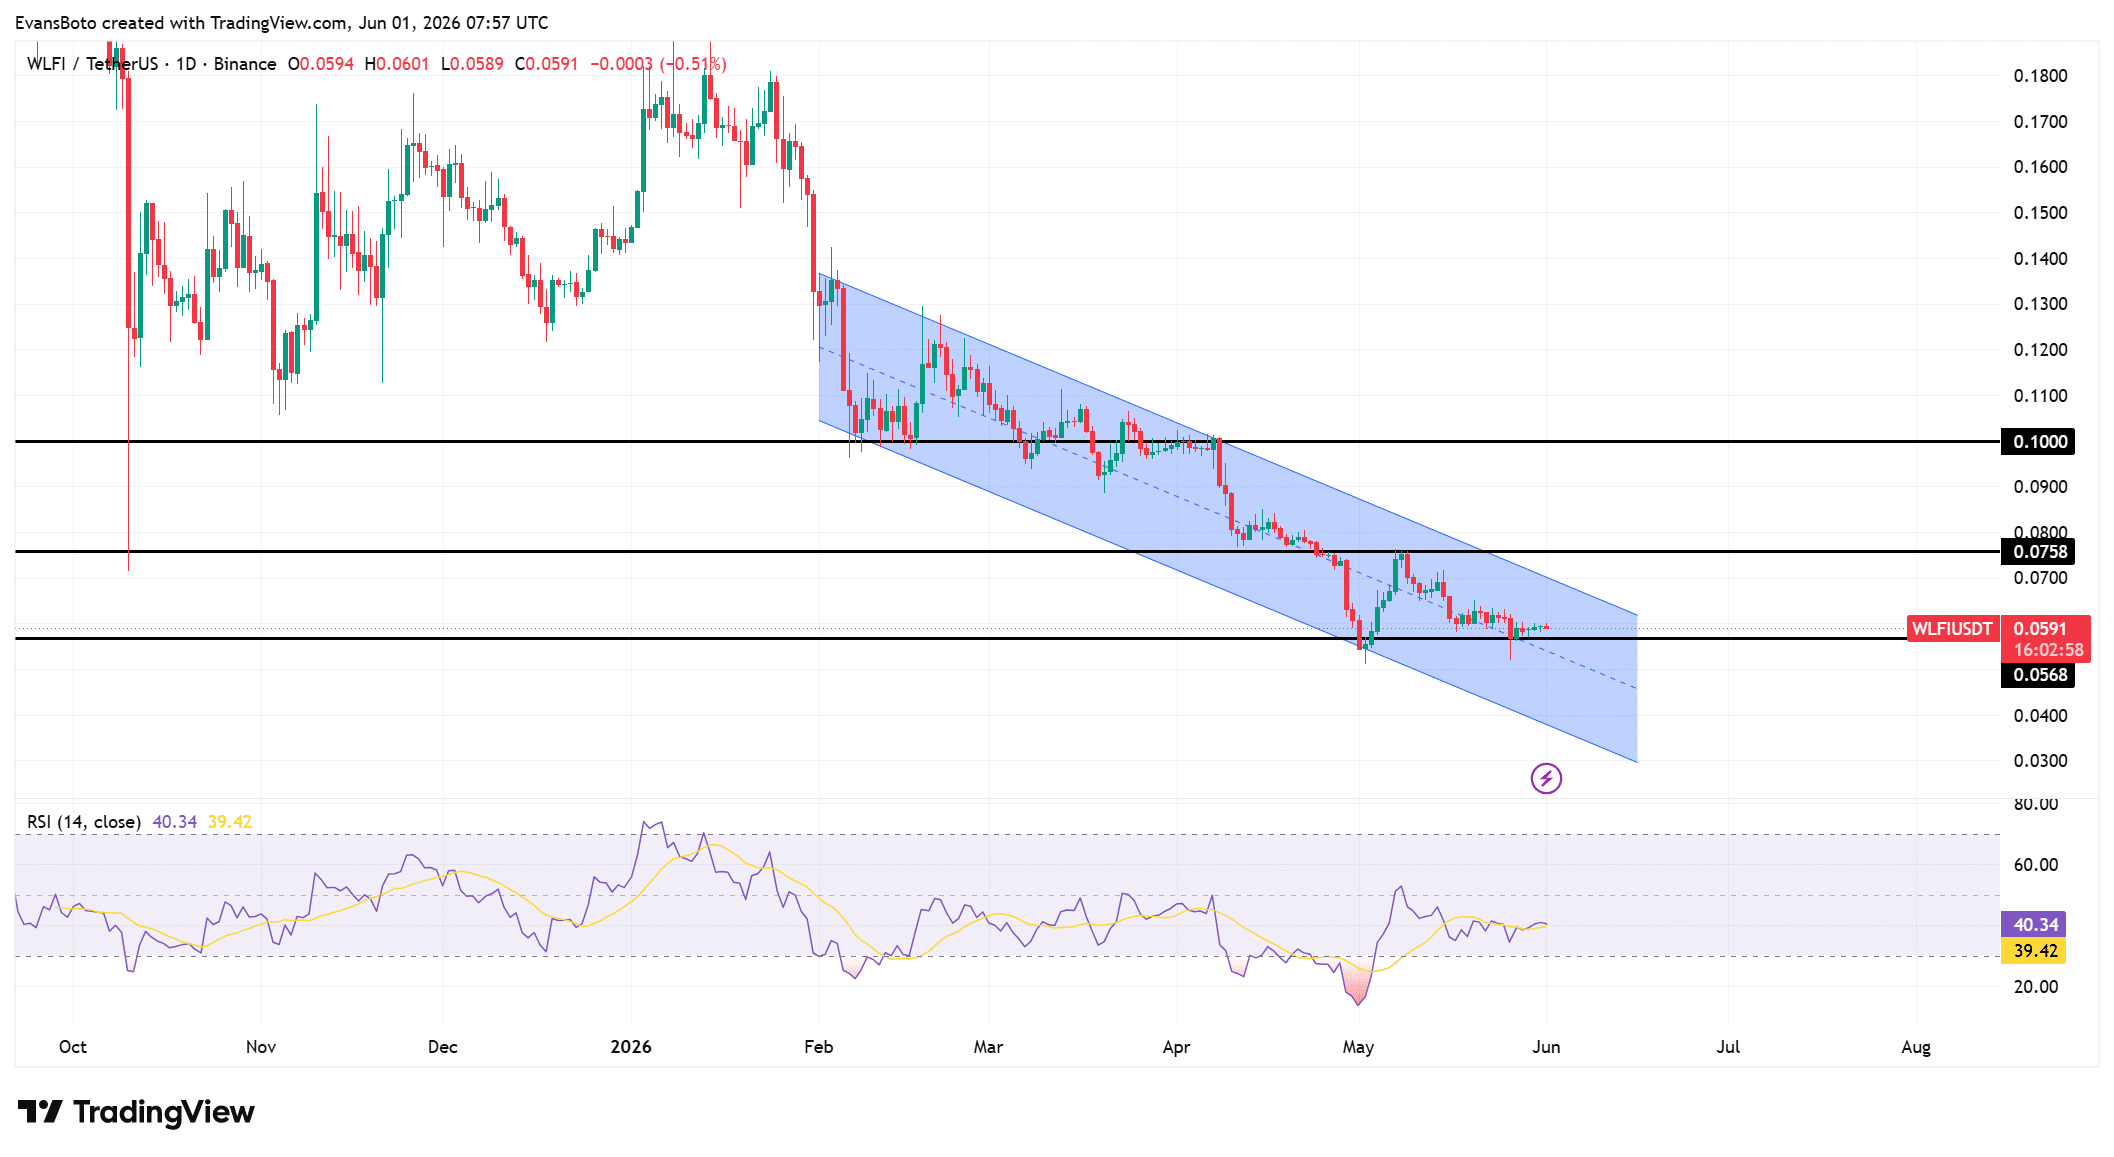
From a price structure perspective, WLFI is still operating within the downward channel formed since February, and the overall trend has not yet reversed. However, buyers have temporarily held the support level of $0.0568, keeping the price stable around $0.0591.
The article mentions that the first major resistance level is at $0.0758, with $0.10 being a higher-level correction target. Meanwhile, the Relative Strength Index (RSI) has rebounded to 40.34, showing some recovery from the previous oversold phase, indicating that bearish pressure has eased compared to the previous weeks, but the indicator has not yet returned above 50.
Funding rates remain positive
Derivatives data also shows that leveraged traders are cautiously optimistic. At the time the report was published, WLFI's weighted average funding rate for open interest was 0.0058%, indicating that long positions were still paying a premium to maintain their positions.
A positive funding rate typically indicates that market demand for long positions is higher than for short positions. Compared to the previous frequent shifts in bullish and bearish sentiment, this indicator has recently remained in positive territory, reflecting that some traders are still betting on a price rebound. If positive funding rates, net outflows from exchanges, and large-scale increases in holdings continue to occur simultaneously, the foundation for WLFI's recovery may be further strengthened.