

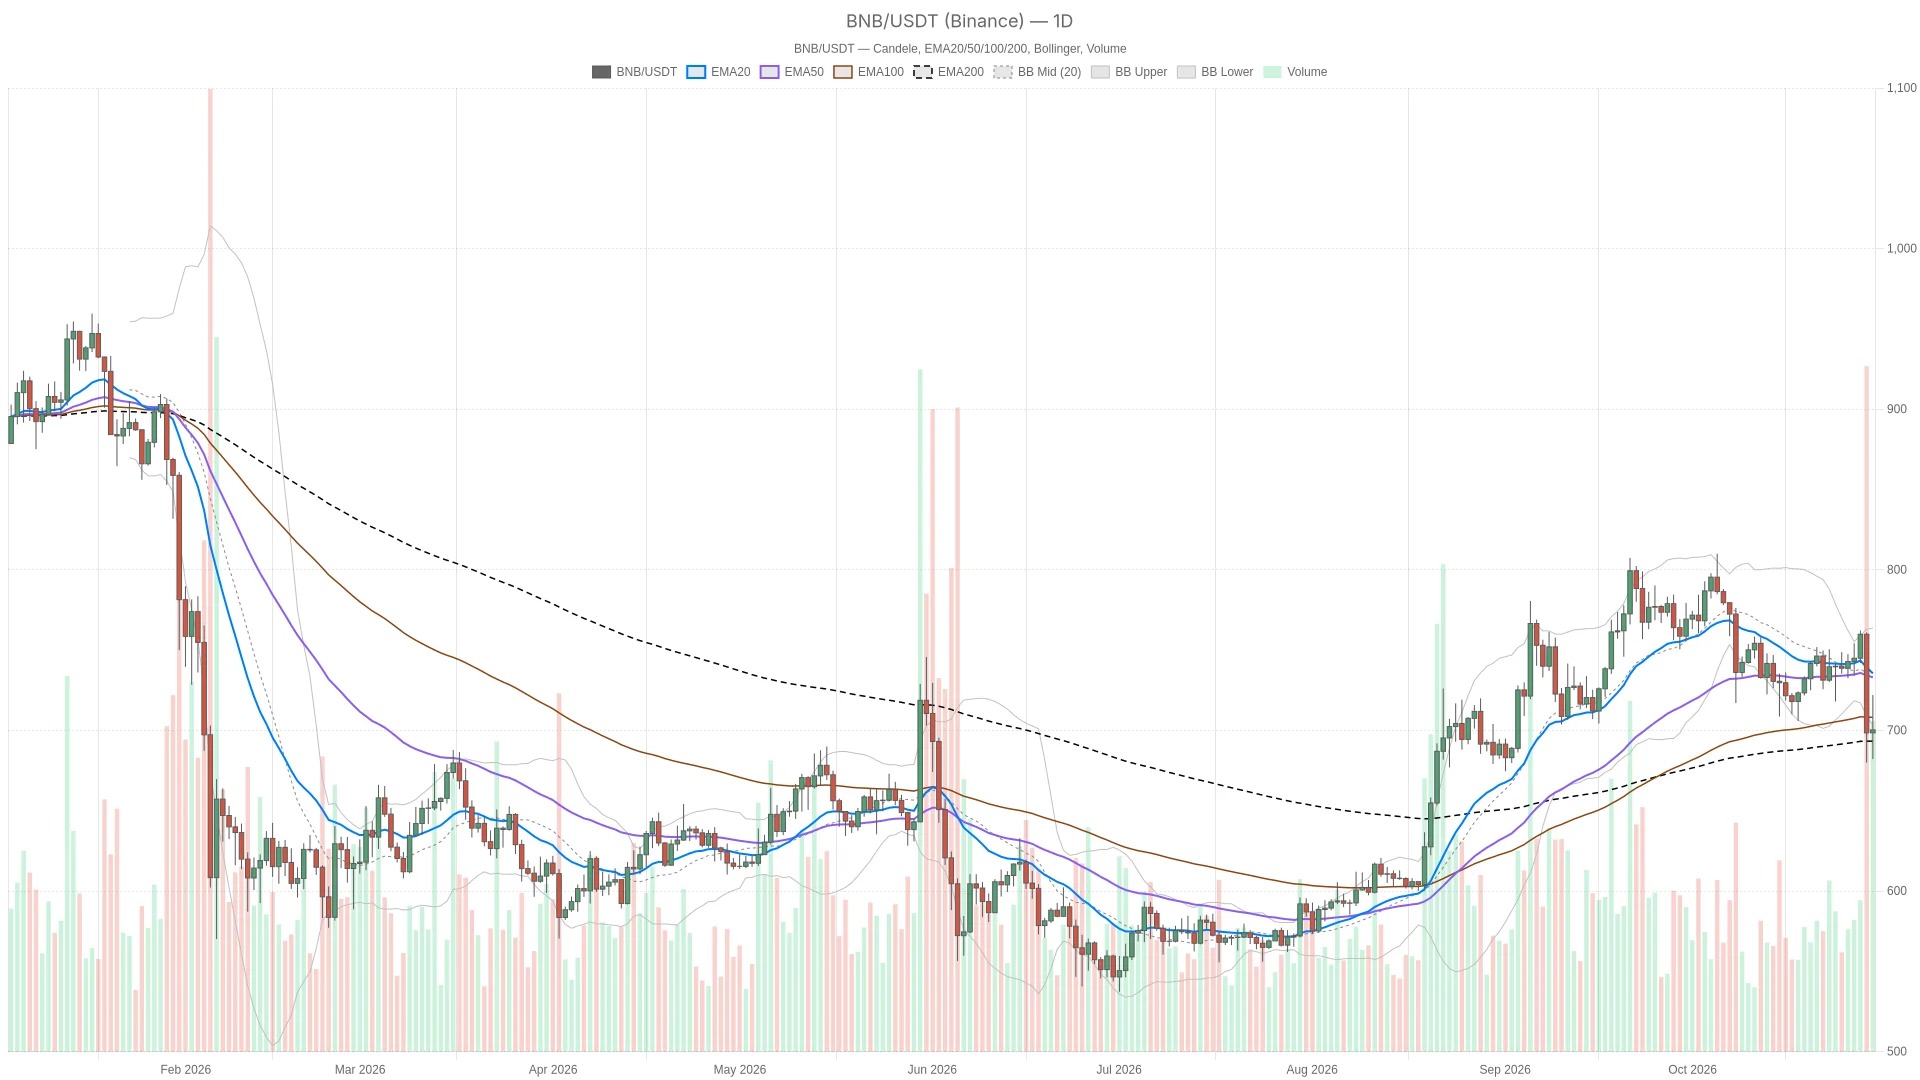
As of October 30, 2026, BNB is trading at $700.30 on Binance. The price pattern of BNB on the daily chart is neutral, but it clearly has a defensive stance. The price is still above the daily EMA200, yet it is below the faster-moving daily moving average. Meanwhile, the bearish conditions at the hourly level constitute the main tone for short-term trading.
Key Points
- BNB reports $700.30, which is higher than the daily average of $693.26 for EMA200, but lower than the daily averages for EMA20 and EMA50.
- The daily line RSI is at 36.4, and the bar chart of MACD has turned negative, indicating that the momentum corresponding to the closed K-line is weakening.
- The hourly structure is relatively empty, and the price is below the three-hour EMA. Therefore, any rebound should still be considered as an attempt at recovery for now.
- If the closing price exceeds $702.55 per hour, it will trigger a recovery scenario; if the closing price falls below $700.27, it will confirm the continuation of a bearish trend.
- The total market value of cryptocurrencies is 2.62 trillion US dollars, and the Fear & Greed Index is at 30, indicating a "fear" zone.
However, the current core contradiction is as follows: there may be a rebound in the short term, but the correction at the daily time frame has not yet ended. The improvement in momentum at the 15-minute time frame provides room for mean reversion, but this does not mean that the broader weakness has ceased. The daily chart still requires a price recovery in order to align again with its relatively bullish moving averages.
Binance Security concerns create a defensive market context

Reports regarding the hack attack on Binance and security concerns, along with the decline in prices, constitute the current direct news context. In this situation, it is more important to technically distinguish between a "mitigating rebound" and a "sustainable recovery" than to focus solely on positive intraday signals.
BSC The 24-hour trading volume of Chain 24 is DEX $1,529,339,308.28. The activity level of the trading venues varies across different statistical periods: PancakeSwap AMM V3 shows a 76.57% increase in daily trading volume and a 130.57% increase over 7 days; PancakeSwap Infinity experiences an 8.79% increase in daily trading volume but a 55.44% decrease over 7 days. The article points out that this represents the trading activity of the entire chain, not the trading volume or transaction fee revenue of BNB itself. Therefore, it is not possible to determine the demand for this asset based solely on these data.
BNB The price holds above the daily line EMA200, but the hourly structure remains bearish.
The daily moving averages are still arranged in a bullish trend, but the price is below the daily EMA20 of $739.22 and the daily EMA50 of $734.30, while it is still above the daily EMA200 of $693.26. This supports the judgment of "neutral on the daily chart" rather than "confirmation of continued upward trend": the long-term reference levels are still valid, but the faster-moving averages currently act as resistance above.
The hourly chart weakens this larger-level balance. The price is below the hourly levels of $713.91, $727.65, and $736.56, respectively, and these levels are arranged in a bearish sequence. Therefore, until the price recovers above these levels, any short-term rebound should be seen more as an attempt at correction.
The 15-minute chart also shows a EMA pattern with empty spaces, with prices below all three moving averages. Its role is merely to provide a background for execution: this short-term improvement at this level cannot reverse the downward trend on the hourly chart, nor can it alone fix the daily chart.
Daily negative momentum conflicts with the 15-minute rebound signal.
The daily line RSI has dropped to 36.4, and the bar chart for the daily line MACD has also turned negative. These two readings, based on completed candlestick charts, indicate that momentum is weakening, rather than just short-term price fluctuations. The RSI has not yet entered an oversold area, so there is no basis to consider this round of decline as having been exhausted.
The hour RSI is at 34.3, while the bar chart for hour MACD still shows negative values. Neither indicates a clear signal of kinetic energy reversal: recently, the trend in RSI has been flat, and the sequence of the bar chart is rather mixed. The evidence at the hourly level still supports the view that "the market is weak," rather than confirming a recovery.
On the 15-minute chart, RSI is at 40.4, and the bar chart for MACD has crossed above the zero axis and turned positive. This is the clearest counter-trend signal in the current snapshot, but it conflicts with the bearish price structure. A rebound can occur, but it may not necessarily develop into a trend reversal.
The position of the daily Bollinger Bands further reinforces this distinction. The price is below the lower Bollinger Band at 708.87 USD, while the middle band at 735.90 USD is located above. Operating outside the lower band makes a mean reversion attempt more likely, but this does not guarantee that it will definitely happen, as the daily momentum remains negative.
The daily ATR is at $24.15, and the hourly ATR is at $8.35. Compared to the nearby hourly pivot levels, such fluctuations are not small; therefore, even if the price crosses a local threshold, it does not necessarily mean that a sustained direction has been formed.
The hour R1 marks the dividing line between repair attempts and further testing to ensure stability.
The recent resistance level is $702.55 at the hourly R1. Below that price, the hourly pivot point of $700.27 serves as the first support level, followed by $698.61 at the hourly S1. Therefore, BNB is currently closer to the first downward decision point rather than firmly holding above the support level.
Bullish scenario: The hourly close exceeds $702.55.
If the hourly close exceeds $702.55, which is the R1 level, it will trigger a short-term recovery scenario. Subsequently, it may test the lower Bollinger Band level of $708.87 on the daily chart, and then look towards the daily pivot point of $713.15. The article suggests that this will initially be a mean reversion movement within a neutral daily chart structure, rather than evidence of a resumption of an upward trend. If the hourly close falls back below the hourly pivot point of $700.27, then this recovery scenario will not hold true.
Bearish scenario: The hourly closing price falls below $700.27
If the hourly close falls below the hourly pivot point of $700.27, it will trigger a continuation of the bearish trend, with support at the hourly level of $698.61 (marked as S1), followed by the daily level of $693.26 (marked as EMA200). If the hourly close manages to rebound above the hourly pivot point of $702.55 (marked as R1), then this immediate bearish scenario will not materialize. The daily level of $693.26 (marked as EMA200) remains an important structural boundary; merely testing this level within a single day is not sufficient to constitute a daily-level breakdown.
The article suggests that the most likely false signal would be a brief upward breakout driven by a positive 15-minute bar chart, but the hourly structure would still remain bearish. Hourly fluctuations also indicate that a price piercing below the pivot line may not be decisive. The latest completed hourly closing price is $700.88, which does not meet the triggering conditions for any of the scenarios; what is emphasized here is the “closing price” rather than an instantaneous crossing.
Frequently Asked Questions
BNB is already oversold on the daily chart?
No. The daily line RSI is at 36.4, indicating weak momentum, but it has not yet reached the oversold threshold. A price drop below the lower Bollinger Band of the daily line is another signal of price extension and does not mean that the selling pressure has ended.
DEX Is the enhanced trading activity sufficient to establish a bullish outlook for BNB?
Not possible. The relevant data reflects the entire BSC blockchain, not just the BNB single asset, and the trends in trading venues vary across different time periods. This data can only provide a background of activity and cannot resolve the conflict between the “daily neutral structure” and the “hourly bearish conditions.”
This article was generated with the assistance of artificial intelligence and has been reviewed by an editorial team.
Lorenzo Marcek is a financial journalist and senior crypto market analyst, renowned for his clear, data-driven reporting on digital assets. With a background in economics and over a decade of experience covering global markets, he focuses on on-chain indicators, institutional adoption trends, and macroeconomic factors that drive fluctuations in the crypto market. His work combines investigative journalism with insights into the technology market, making him a trusted source that provides traders with solid and actionable analysis.