

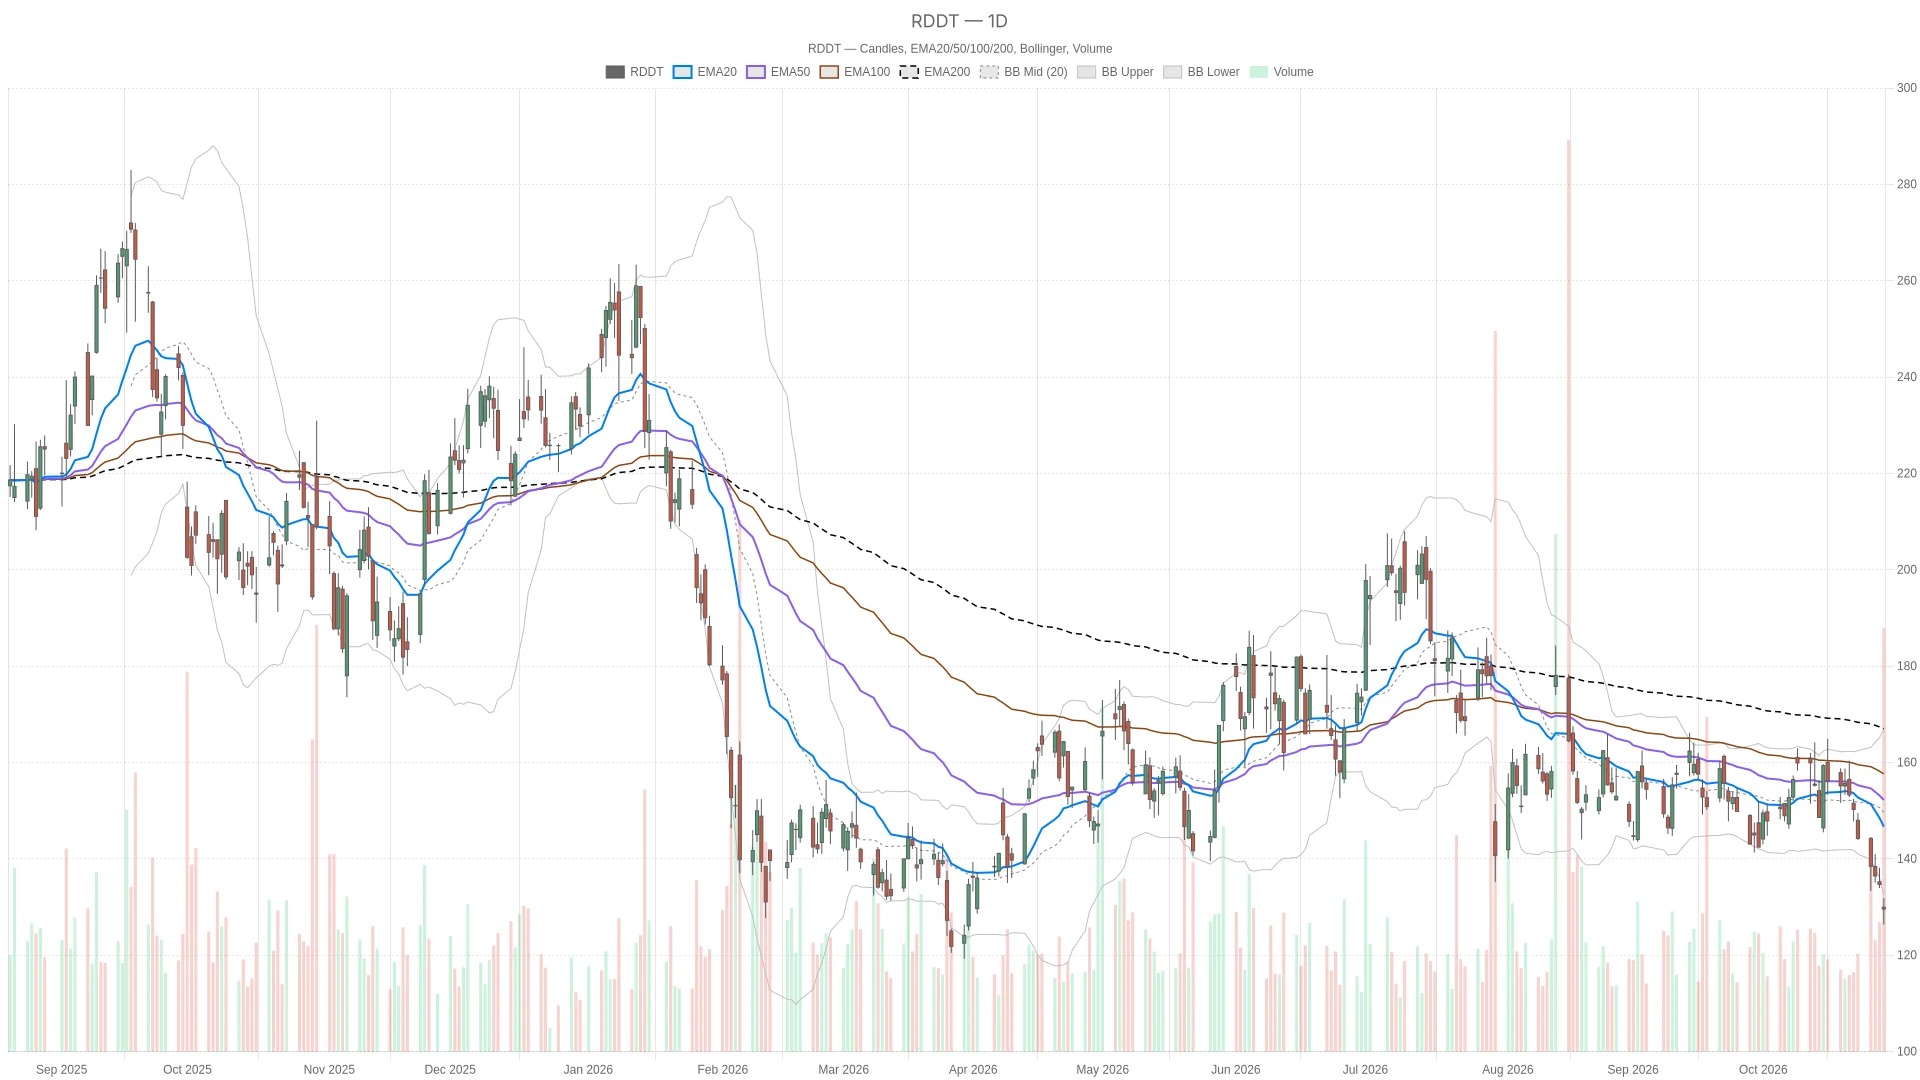
Reddit Stock price analysis shows that the price is reported at $129.60, a decrease of 3.79%. The daily chart structure is bearish, and the stock price is below both the key index moving average and the lower band of the Bollinger Bands.

Although the negative signals have decreased in the shorter term, the daily chart pattern of Reddit stock remains bearish. The price is below all three daily moving averages and the lower band of the Bollinger Bands. At the same time, reports released after the market close have raised concerns that need to be considered separately from the completed candlestick patterns.
Key Points
- Reddit The stock price closed at $129.60 on Thursday, a decline of 3.79%, below the lower band of the daily Bollinger Bands at $132.50.
- The daily line RSI14 is at 30.9, slightly above the oversold threshold of 30; the daily line MACD is at -4.67, below the signal line of -2.14, and the bar chart shows -2.54, which is in the negative range.
- The hourly line RSI14 is at 33.71, which is higher than 23.35 but still below 50; the bar chart for the hourly line MACD shows -0.20, which represents a recovery from the previous value of -0.39.
- The price is below the daily averages of 20-period EMA at $146.70, 50-period EMA at $152.23, and 200-period EMA at $162.84.
- The daily pivot point for the next trading day is $129.29; the first resistance level is $132.20, and the first support level is $126.68.
On Thursday, October 29, 2026, Reddit opened at $129.95, hit a low of $126.37 during the session, and closed at $129.60; the closing price on the previous trading day, October 28, 2026, was $134.70. The decline for that trading day was 3.79%.
Reddit Stock Price News: Separate the day's trend from subsequent reports
The reports that emerged after the close on Thursday were published after the trading session had ended and should be viewed in the context of independent information; they cannot be confused with the completed charts.
A report released after the close on Thursday cited Huffman as saying that search referral traffic “fell significantly in the third quarter, and the decline accelerated in the later part of the quarter.” The report stated that this decline continued into the new quarter.
The technical analysis below refers to the trading period that was completed on Thursday, rather than the market reports before the trading session on Friday.
Reddit The daily stock price structure remains mainly bearish.
The daily chart shows that the stock price of Reddit is in a bearish structure, with the price below all three moving averages and the lower band of the Bollinger Bands.
The daily moving averages are in a bearish arrangement. The price is below the 20-period EMA of $146.70, the 50-period EMA of $152.23, and the 200-period EMA of $162.84, and the shorter moving averages are also below the longer moving averages. This arrangement supports a bearish outlook, rather than a bullish trend.
In addition, the daily RSI14 indicator has dropped from 34.2 to 30.9, approaching the oversold threshold of 30 but still slightly above that level. The MACD indicator is at -4.67, which is lower than the signal line of -2.14, and the negative bar chart shows a value of -2.54. Both indicators indicate that the daily momentum is bearish.
The closing price is also below the lower band of the daily Bollinger Bands at $132.50. The middle band is $149.67, and the upper band is $166.84. This indicates that the price has fallen below the lower boundary, but a reversal has not yet occurred. The daily ATR14 is at $7.57, which provides more reference for volatility rather than a directional signal.
The hourly chart indicates a lack of momentum, but there are still disagreements regarding the short-term trading rhythm.
The hourly chart confirms a bearish reading, but it also raises questions about the short-term momentum. The value is RSI14 at 33.71, which is above the 30-day moving average but still below the 50-day moving average, indicating that the near-term trend remains suppressed.
The closing price is still below the 20-hour EMA of $133.54, as well as the 50-hour EMA of $139.99 and the 200-hour EMA of $148.76. This bearish arrangement confirms the daily chart structure. The price is also below the middle band of the hourly Bollinger Bands at $134.17, but above the lower band at $126.26.
However, the hourly line RSI14 has risen to 33.71, rebounding from the previous level of 23.35. It has now crossed above the 30-line but is still below the 50-line. The bar chart for the hourly line MACD has increased from -0.39 to -0.20, remaining negative, while the MACD line is at -3.76, which is lower than the signal line of -3.57. These changes have strengthened the bearish outlook, but they have not reversed it.
In contrast, the 15-minute chart provides a mixed execution background. The closing price is higher than the 20-period EMA at $129.42, but lower than the 50-period EMA at $131.89. The RSI14 is at 48.85, which is lower than the 50-period level; the MACD line is at -1.02, which is higher than the signal line of -1.32. The positive bar chart at 0.29 conflicts with the negative bar charts on the daily and hourly charts, but it is not sufficient to establish a bullish judgment for the daily chart.
Reddit Stock Price: Bullish and Bearish Scenarios
The daily pivot point of $129.29 for the next trading day is the most direct reference. The first resistance level at $132.20 and the first support level at $126.68 form the near-term range after trading resumes.
If we can hold above the pivot point, it will support a bullish scenario, but a more substantial test lies at higher levels. For a bullish outcome, we need to break through the first resistance level of $132.20 first, and then re-establish ourselves above the lower band of the daily Bollinger Bands at $132.50. After that, the 20-hour EMA level of $133.54 on the hourly chart will become the next reference point. Even if we manage to reach these levels, the 20-day EMA level of $146.70 on the daily chart is still above us. Relying solely on short-term strength is not enough to overcome the broader bearish structure.
On the contrary, if it falls below the daily pivot point of $129.29, this bullish alternative scenario will be weakened. If it then falls below the first support level of $126.68 as well as the low of the current trading day at $126.37, that would negate the assessment that "support has been held."
Overall, the closing price of Reddit was above the daily pivot point of the next trading day, but below the first resistance level and the lower band of the daily Bollinger Bands. The price of ATR14 was $7.57, indicating that volatility remains a key factor in judgment. The unresolved question is: when subsequent news emerges and trading resumes, will the signals from shorter time frames be able to support these prices?
Frequently Asked Questions
What is the daily trend structure of the Reddit stock price?
The daily chart structure is bearish. The stock price closed at $129.60, below the three moving averages of the daily chart: the 20-day EMA at $146.70, the 50-day EMA at $152.23, and the 200-day EMA at $162.84. It is also below the lower band of the daily Bollinger Bands at $132.50.
What did the reports published during that trading period say?
These reports come from Yahoo Finance and Seeking Alpha, and were published after the close on Thursday. They mention concerns regarding search traffic as well as fourth-quarter revenue forecasts that fell short of expectations.
Reddit What are the key levels for the stock price on the next trading day?
The daily pivot point is $129.29. The first resistance level is at $132.20, and the first support level is at $126.68. For a bullish scenario, it is necessary to break through the first resistance level of $132.20 as well as the lower band of the daily Bollinger Bands at $132.50.
Reddit Is there any conflict between stock prices across different time periods?
Both the daily and hourly charts are bearish. However, the 15-minute chart shows mixed signals, with the closing price above the 20-period EMA level, and the MACD bar chart indicates a positive value of 0.29. These shorter-term signals do not overturn the broader bearish trend.
Cryptonomist and the author do not hold any positions in the financial instruments mentioned in this text, nor have they received any compensation from the companies reported.
This article was generated with the assistance of artificial intelligence and has been reviewed by an editorial team.
Lorenzo Marcek is a financial journalist and senior crypto market analyst, known for his clear and data-driven reporting on digital assets. With a background in economics and over a decade of experience covering global markets, he focuses on on-chain indicators, institutional adoption trends, and macroeconomic factors that drive crypto market fluctuations. His work combines investigative journalism with insights into the technology market, making him a trusted voice among traders.