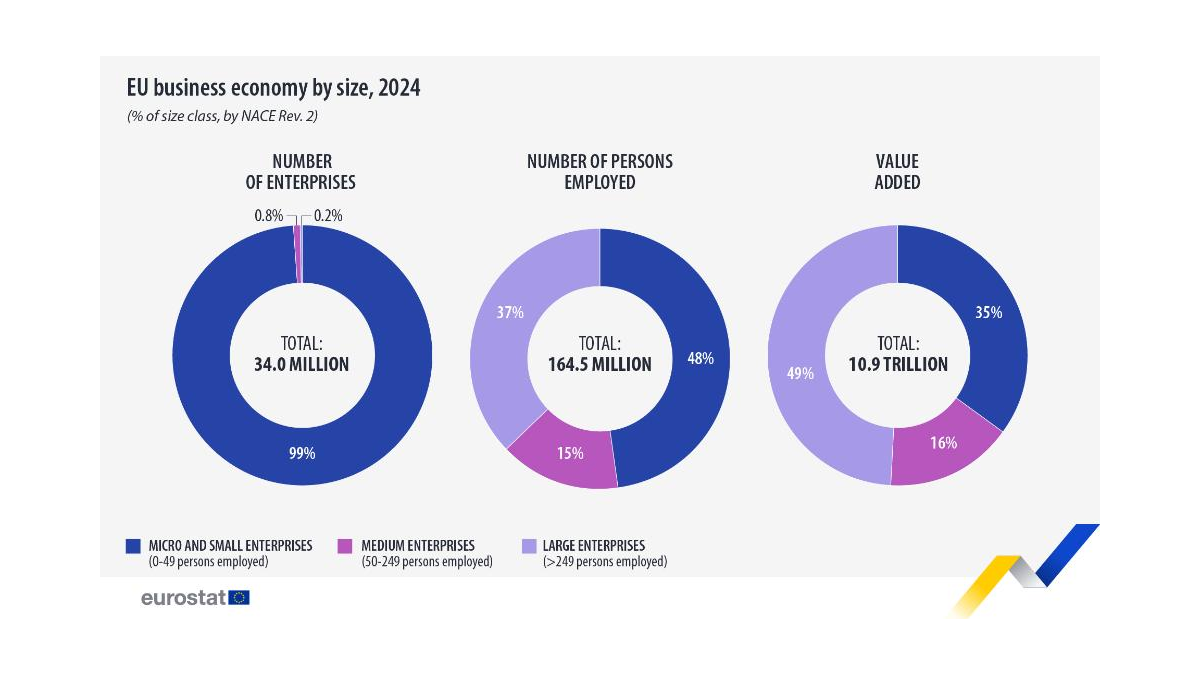
On September 30, the European Statistical Office released the final figures for 2024 structural business statistics: there are approximately 34 million businesses in the EU, employing 164.5 million people including self-employed individuals, with turnover exceeding 38.7 trillion euros and generating a value added of 10.9 trillion euros. What is more noteworthy is not the number of businesses themselves, but rather their size distribution: large enterprises with over 249 employees account for only about 0.2% of the total number of businesses, yet they contribute about 49% of the value added and 37% of employment. The scale effect remains a key to understanding Europe's productivity and competitive landscape.
These numbers do not represent the number of newly registered companies this year, nor are they a census of all public sectors. Structural business statistics cover commercial economic activities with clear boundaries, and the statistical year is 2024. The final data was released on September 30th. Referring to “34 million companies” as new additions in September 2026, or mistaking turnover for GDP, would change the meaning of these numbers. Turnover records sales revenue, while added value is closer to the economic value created by companies during the production process; therefore, the two cannot be directly added together or interchanged.
The presence of many enterprises does not mean that the output is evenly distributed.
Eurostat counts micro and small enterprises together as accounting for about 99% of the total number of businesses. This large group provides 48% of employment, but generates only 35% of the added value. Medium-sized enterprises account for approximately 0.8% of the total, providing 15% of employment and 16% of the added value. Large enterprises are few in number, yet they contribute nearly half of the added value. By combining these three groups, one can see the dual structure of the European economy: small businesses are an important source of employment and community commerce, while a minority of large enterprises concentrate capital, technology, brands, and cross-border sales channels.
The high proportion of added value created by large enterprises does not imply that small enterprises are “inefficient” or can be replaced. Restaurants, repair services, professional services, and local contractors often serve regional needs and are labor-intensive, providing dispersed and stable employment. The scale of enterprises, the composition of industries, and the degree of capital intensity influence each other; therefore, it is not appropriate to rank each enterprise solely based on the overall proportion. For example, even if a software company, a construction contractor, and a supermarket have the same number of employees and sales volume, the ways in which their added value is generated may be quite different.
For policymakers, the challenge posed by structural differences is how to enable small businesses to access financing, digital tools, and cross-border markets, while avoiding high entry barriers that could hinder their growth. Encouraging businesses to grow does not mean turning all small firms into large corporations. If regulatory costs, language barriers, and market fragmentation make it difficult for companies to operate internationally, innovative products may remain confined to local markets in the long term; conversely, if only a few giants are supported, local employment and competitive vitality may also be compromised. Data provides a context for consideration, but it does not make direct policy decisions on behalf of policymakers.
From an industry perspective, the service sector accounts for 64% of enterprises, 53% of employment, and 51% of added value, making it the main body of the commercial economy. Industrial enterprises account for only 7% in terms of numbers, but they contribute to 20% of employment and 28% of added value; trade enterprises comprise 17% of the total number of enterprises, generate 18% of employment, and contribute 15% of added value; the construction industry accounts for approximately 12%, 8%, and 7% of these figures respectively. Therefore, when discussing 'European enterprises', one cannot focus solely on the number of street-side shops or just look at the exports of large manufacturers. Different industries have varying sensitivities to wages, energy prices, credit, and digital investments.
When looking at growth from the perspective of structural data, two misconceptions need to be avoided.
Firstly, a single-year snapshot cannot establish a causal relationship. The high share of added value by large enterprises may be related to capital equipment, R&D investment, and industry concentration, as well as their ability to operate internationally; it is not possible to conclude from this table alone that a certain policy has increased or decreased productivity. To determine trends, it is necessary to compare data over multiple years using consistent criteria and to control for industry, national, and price variations. Simply subtracting the end-of-2024 figures from the earlier estimates from last year may also result in a difference due to revisions.
Secondly, the number of enterprises in a statistical sense does not mean that each business entity is of equal size. A professional studio that employs just a few people and an industrial group that operates across multiple countries are both considered as separate enterprises. If we calculate the average turnover and employment figures per company, it can easily obscure the actual distribution. When reporting on the corporate ecosystem, it is important to provide information on both the number of enterprises, employment levels, and added value. We should avoid statements like “small and medium-sized enterprises account for the absolute majority” that might lead readers to mistakenly believe that they also generate the vast majority of economic output.
This statistic also serves as a reminder for the capital market. If the growth of the EU is to accelerate, it cannot rely solely on the number of new businesses; it is also important to see whether existing companies can increase labor productivity per unit, expand markets, and introduce technology. Large enterprises have advantages in capital and research and development, while small and medium-sized enterprises can more quickly capture niche demands. The supply chains, payment, and service networks that connect the two may be even more crucial than simply determining who holds the majority. The structural values projected for 2024 depict the economic landscape, but whether this can translate into stronger growth in the future will depend on subsequent investment, employment, and productivity data.
This also explains why it is difficult for the enterprise services market to cover all customers with a single unified solution. Large corporations may be willing to invest in budget for cross-border compliance, data governance, and complex system integration, while small businesses need tools that are cost-effective and can be launched quickly. If the number of enterprises is used to estimate the software market, 99% of small and micro enterprises would seem particularly attractive; however, if the estimation is based on payment capability and decision-making cycles, the conclusion might be completely different. The scale distribution provided by statistical bureaus offers a starting point for tiered observation, but business judgments must also take into account industry and region.