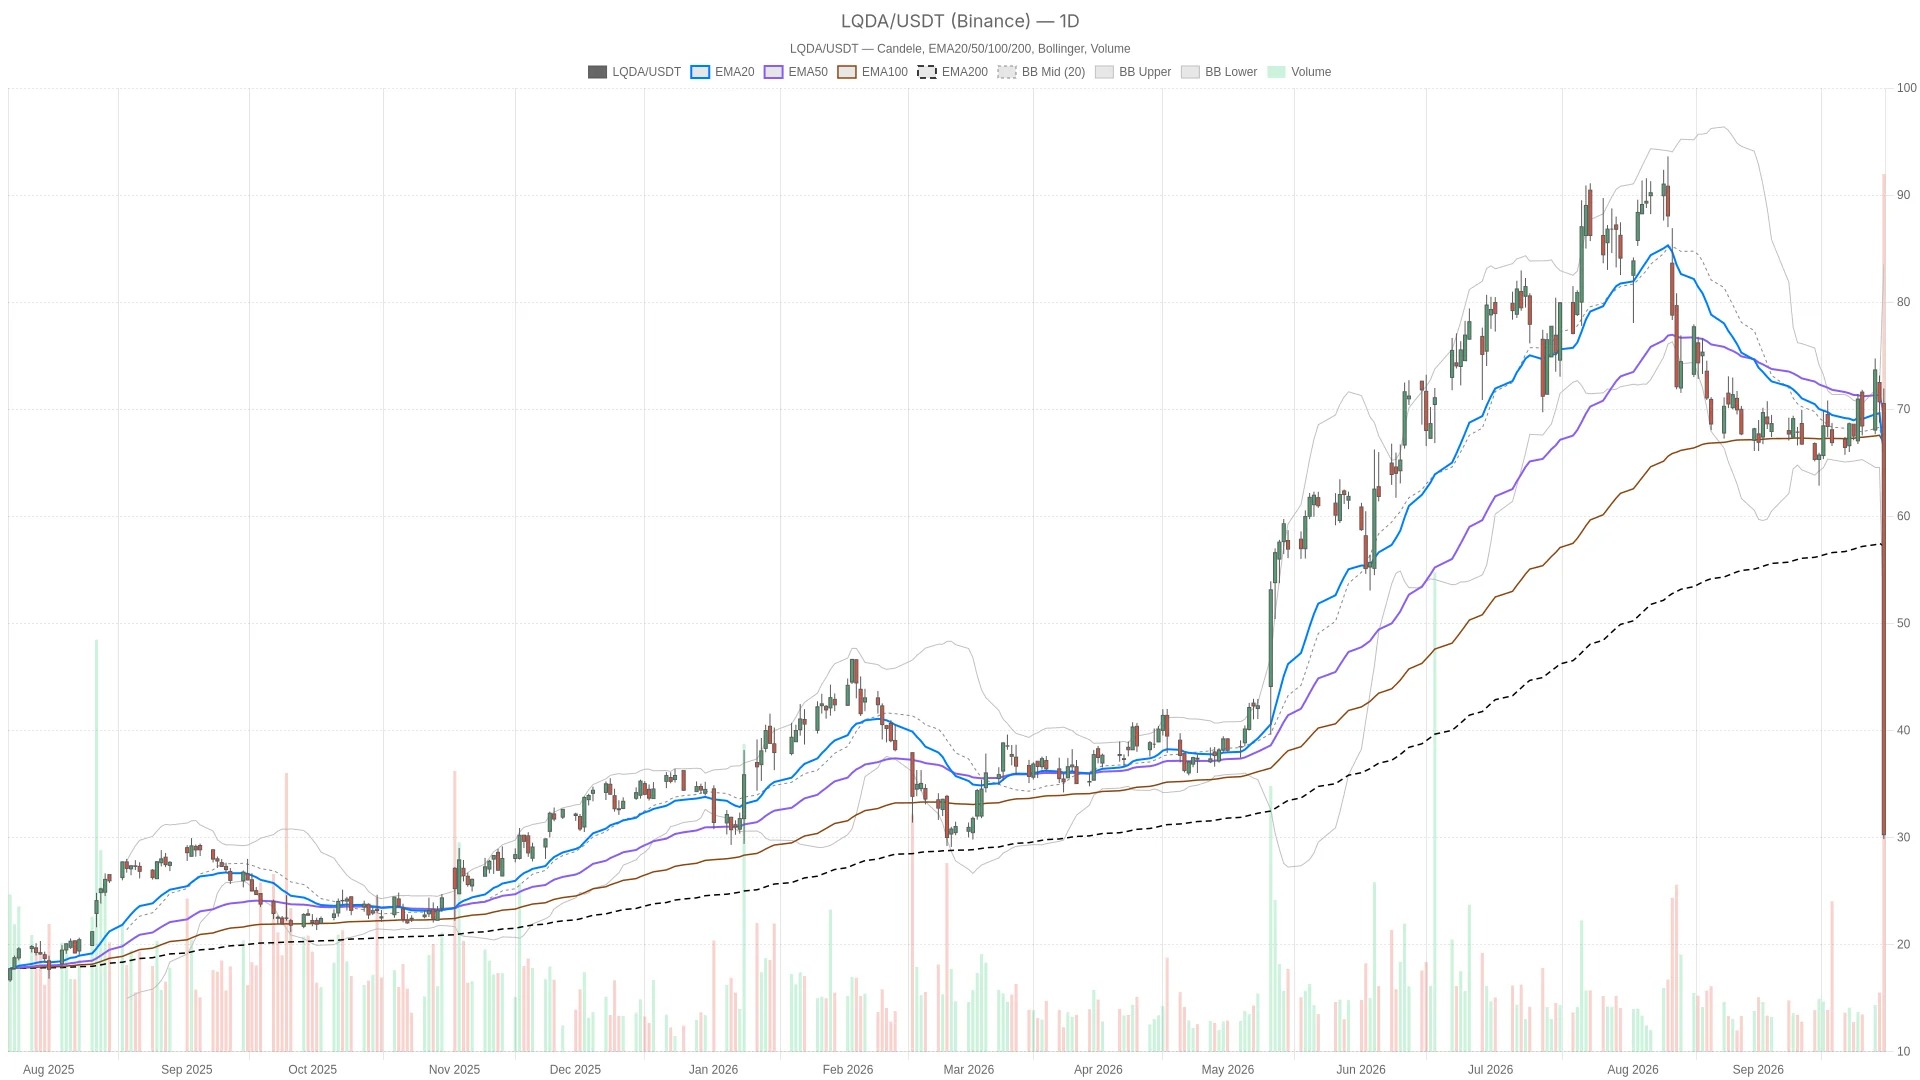
Liquidia's stock price plummeted by 57.19% on Wednesday, closing at $30.26, compared to $70.69 on the previous trading day of September 29, 2026. Previously, a U.S. federal court ruled in a patent dispute with United Therapeutics that Liquidia's YUTREPIA lung disease drug infringed upon one of the other party's patents. Trading volume soared to 22,770,901 shares, causing changes in the technical patterns across various time frames.
Key Points
- The daily chart RSI14 fell to 20.23, deeply entering an oversold zone, and the closing price was also far below the lower band of the Bollinger Bands at 49.45 dollars.
- From the daily chart, hourly chart to the 15-minute chart, the stock price is below the main EMA, indicating a structural breakdown.
- After the market closed, BTIG downgraded the stock rating of Liquidia to neutral, which is directly related to this patent ruling.
- The hourly chart RSI14 shows 18.38, and the 15-minute chart RSI14 shows 17.47, indicating that short-term momentum is extremely exhausted, with a risk of a rebound.
What happened: Liquidia stock and YUTREPIA ruling
During trading on Wednesday, Yahoo Finance reported that the United States District Court for the District of Delaware ruled that Liquidia's lung disease medication infringed upon a key patent held by United Therapeutics. The report described this ruling as a major blow to the commercial prospects of that therapy. Liquidia's CEO, Roger Jeffs, stated that the company does not agree with this decision and will "seek all available avenues of appeal."
According to a report published by Investing.com during the trading session, after the ruling caused the stock price to plummet by 48%, options trading activity surged. This surge highlighted the suddenness of the intraday position changes.
After the close of trading, Seeking Alpha reported that Liquidia tumbled by 57% due to this lawsuit, which is roughly in line with the final closing decline. Additionally, according to a post-closing report from Investing.com, BTIG downgraded the stock rating of Liquidia to neutral following the patent ruling. Since this rating adjustment occurred after the close on Wednesday, it represents a reaction from analysts after the market closed and was not a driving factor for trading during that day.
Daily trend: Severe structural damage

The daily candlestick chart for Wednesday speaks volumes. The stock price opened at $70.54, reached a high of $71.93, fell to a low of $29.86, and ultimately closed at $30.26. On the 14th, the ATR indicator was at 6.38, indicating that volatility had expanded significantly above normal levels.
The current stock price has fallen below three major daily moving averages: the 50-day EMA is at $69.67, the 20-day EMA is at $65.88, and the 200-day EMA is at $56.91. This arrangement is not a standard bearish pattern; however, with the stock price currently at only $30.26, which is far below these three moving averages, it indicates that the stock has clearly deviated from its recent trend structure.
The momentum indicator also confirms this point. The daily RSI14 has fallen to 20.23, deeply in the oversold zone. Meanwhile, the MACD line is at -3.86, the signal line is at -2.15, and the bar chart shows an expansion of negative values at -1.71. The closing price of the stock is also far below the lower band of the Bollinger Bands, which is at 49.45 dollars, with the middle band at 66.48 dollars and the upper band at 83.52 dollars.
It is worth noting that such a significant decline below the lower track is not common. This seems more like a panic sell-off rather than an orderly pullback. In the daily pivot point structure, the stock price is sandwiched between the pivot point of $44.02 and the first support level of $16.10, with the resistance level of $58.17 lying far above.
Hourly chart confirms a bearish pattern.
The 1-hour chart further reinforces the analysis from the daily chart. The stock price of $30.19 is below the 20-hour EMA of $58.00, which in turn is below the 50-hour EMA of $64.05. The 50-hour EMA is also below the 200-hour EMA of $69.87. This constitutes a textbook example of a bearish pattern, with all moving averages lying above the stock price in chronological order.
The hourly chart RSI14 shows a value of 18.38, which is more extreme than the daily chart reading. The MACD line is at -8.03, the signal line is at -3.39, and the bar chart shows -4.65; the negative gap is even larger than that on the daily chart. Therefore, the short-term trend confirms a bearish tendency more strongly than the daily trend.
The hourly pivot point is at $30.95, the resistance level is at $32.04, and the support level is at $29.10. The current stock price is slightly below the pivot point.
Execution level of the 15-minute chart
On the 15-minute chart, the same bearish pattern still holds true. The stock price of $30.19 is lower than the 20-period EMA level of $47.36, which in turn is lower than the 50-period EMA level of $58.53, and the 50-period EMA level is also lower than the 200-period EMA level of $65.94.
In the 15-minute period, RSI14 is at 17.47, indicating extreme overselling. The MACD bar chart shows -2.27, while the MACD line is at -10.43, and the signal line is at -8.16, suggesting that sellers continued to exert pressure before the close. The 15-minute pivot point is $30.41, with resistance at $30.96 and support at $29.64. The stock price is slightly below the pivot point and close to this near-term support level.
For short-term positions, this is mainly a reaction level map, rather than an independent trend signal. Within this time frame, the chart simply indicates that sellers still held the dominant position in the last 15 minutes.
Bullish scenario: Under what circumstances could a rebound occur?
However, a short-term rebound is not impossible. The oversold readings on all three time frames are already very extreme. For a rebound to occur, the stock price first needs to regain the 15-minute pivot point of $30.41; subsequently, it also needs to recover the hourly pivot point of $30.95. Only if it can remain above the hourly resistance level of $32.04 for an extended period can that be considered the first real signal that selling pressure is beginning to ease.
Bearish scenario: Under what circumstances would a further decline be confirmed?
On the other hand, as long as the stock price remains below the hourly and daily lines EMA, the bearish scenario remains valid. If it breaks below the hourly support of $29.10, that would be the first warning sign. If it then fails to hold the 15-minute support of $29.64 as well, it indicates that the sellers have not yet given up.
Looking further ahead, if the price continues to fall to the first support level of $16.10 on the daily chart, it will confirm a deeper level of re-evaluation. This suggests that the trend on Wednesday could be the beginning of a new round of price resetting, rather than an isolated impact. After the market closed, BTIG downgraded its rating to neutral, which also increased the cautious sentiment among analysts; this cautious attitude is unlikely to be overturned by bullish arguments until there are changes in the appeal process.
Similarly, if the bar chart on the daily and hourly timeframes MACD continues to show negative values, it will also undermine any bullish attempts and confirm the continuation of the downward trend.
Liquidia Stock: Technical Outlook After a 57% Plunge
Overall, on the start of the new trading day for Liquidia stock, a structural breakdown has appeared on the daily chart. The hourly chart confirms a bearish trend with clear arrangements of moving averages. The 15-minute chart is still looking for support near the intraday lows.
At the same time, in all time frames RSI, the levels are between a dozen and just over twenty, conveying a clear message: there is a possibility of a strong counter-trend rebound at any time. The active option trading mentioned during Wednesday's session also indicates that positions are still not stable.
Considering the significant fluctuations on Wednesday, the pending appeal process, and the latest downgrade in ratings, it is very likely that volatility will continue to remain high in the future. Any short-term technical signals should be viewed with caution until the prospects for litigation become clearer.
Frequently Asked Questions
What caused the Liquidia stock to fall by 57% on Wednesday?
A federal court ruling in the YUTREPIA patent dispute determined that Liquidia's lung disease medication infringed upon a key patent held by United Therapeutics. This decision dealt a significant blow to the commercial prospects of that therapy and triggered a record daily decline in the stock price.
After the sharp decline, what is the technical position of Liquidia stock?
The stock has fallen below all the main EMA levels on the daily, hourly, and 15-minute charts. The daily RSI14 level has dropped to 20.23, indicating severe oversold conditions, and the closing price is also far below the lower band of the Bollinger Bands at 49.45 dollars. The MACD bar charts on all time frames still show clearly negative values.
What are the key price levels to watch for stocks?
On the downside, the support level on the hourly chart is at $29.10, and the first support level on the daily chart is at $16.10. For a rebound to occur, the stock price needs to first recover the 15-minute pivot point of $30.41 and the hourly pivot point of $30.95. If it can remain above the hourly resistance level of $32.04, that would be the first sign of diminishing selling pressure.
Did any analysts adjust the rating of Liquidia stock after the ruling?
Yes. After the close on Wednesday, BTIG downgraded the stock rating of Liquidia to neutral, attributing this downgrade directly to the patent ruling. This reflects the cautious attitude of analysts after the market closed, rather than being a driving factor for selling during trading hours.
This article was generated with the assistance of artificial intelligence and has been reviewed by an editorial team.