Newsletter
- In September, the United States only added 29,000 new jobs, which is lower than the expected 84,000; the market's probability of a Fed interest rate hike in October has dropped from 70% earlier this week to about 14%.
- Bitcoin is trading at $86,152, which is about 1.4% lower than its September high of $87,354.
- BTC What will come next? The following is what the chart shows.
What is bad news for the economy has once again become good news for risk assets.
In September, the United States only added 29,000 new jobs, far below the economists' forecast of 84,000. According to data from the U.S. Bureau of Labor Statistics, the figures for the previous two months were revised downward by 60,000, and the unemployment rate rose slightly to 4.2%.
Wall Street's interpretation is that the pressure to continue raising interest rates has just eased a bit, which is usually positive for risk assets such as Bitcoin. The largest cryptocurrency by market capitalization saw a clear rise after the release of macro data on that day, and charts indicate that in this month, which the market affectionately calls “Uptober”, Bitcoin may still have further upside potential.
Before delving into the data, traders and investors need to understand some background: On September 16th, the Federal Reserve unanimously voted to raise interest rates by 25 basis points, raising the target range to 3.75%-4.00%. This was the first rate hike since 2023. Higher interest rates mean that there is less "cheap money" available for investment, but Bitcoin has shown a clear resilience to this change compared to the Wall Street stock market.
However, thereafter, the officials' attitude softened somewhat. New York Fed Chair John Williams stated on Tuesday that "there is no need to rush into action"; Fed Vice Chairman Philip Jefferson said on Thursday that policymakers may need more time before deciding whether to raise interest rates again.
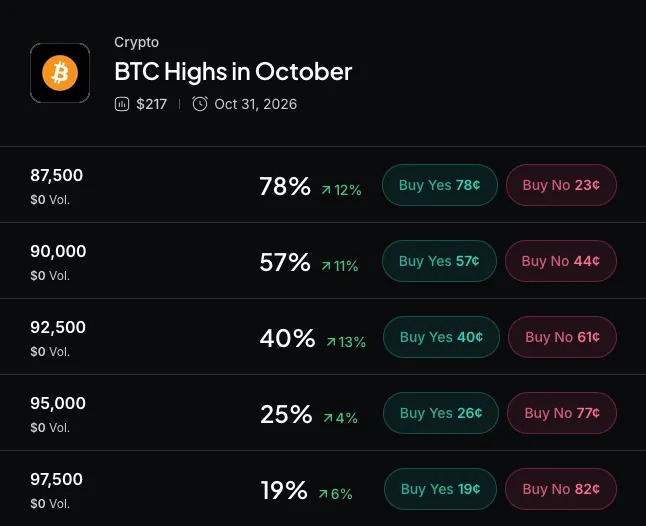
After the release of this report, CME FedWatch indicates that the probability of a Fed interest rate hike at its October meeting has significantly decreased, from 70% earlier this week to 14%. The predictions of the market Kalshi, Polymarket, and Myriad are also in agreement: there is an 80% chance of no action on October 28th.
Bitcoin price: Approaching the upper ceiling
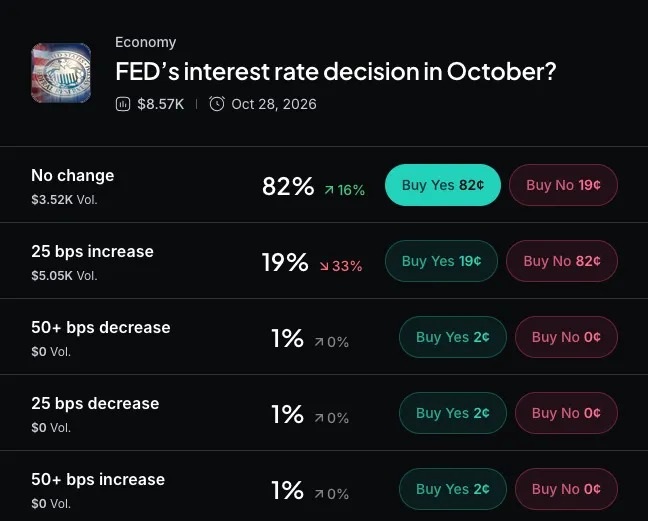
Bitcoin rose 1.57% on the day to reach $86,152.75, with an opening price of $84,824.05. The high point of the daily candlestick chart reached $87,173.15, just a step away from the September high of $87,354.33; the latter constitutes the top of the current range and is also an annual resistance level that bulls need to break through. The intraday low was $84,492.18.
The September high point appeared at the end of an upward trend that started from a low of $74,977.57, with a cumulative increase of 16.5%. Since then, Bitcoin has been consolidating around this level. Below are the signals given by various indicators regarding whether it will be able to break through this level.
The Average Directional Index ( ADX ) measures the strength of a trend, without distinguishing its direction. A reading above 25 generally indicates that a trend is indeed present. Currently, the ADX of BTC is 41.8. The trend lines show that the buying power ( DI +) is stronger than the selling power ( DI -), which means that we are in a strong upward trend, rather than a volatile market. However, a very high ADX reading also suggests that this trend has become quite mature.
The Exponential Moving Average ( EMA ) is used to track the average price, giving more weight to recent prices. The chart shows that the faster 50-day EMA is above the slower 200-day EMA, which is a typical bullish pattern, usually indicating that short-term momentum is stronger than the long-term trend. The shaded cloud band below the price has also remained green since mid-August, serving as a buffer.
The Relative Strength Index ( RSI ) measures buying pressure on a scale from 0 to 100. Currently, the RSI is at 68.1, indicating strong momentum, but it has approached the 70 level, which is usually when traders start to take profits in this area.
Squeeze Momentum Indicator is currently in a "closed" state, with a reading of 2.2. This indicates that the compression phase that drove this round of market activity has ended, and volatility has been released upwards. The price of Bitcoin is currently at 78.4% of its range, within the upper half of that range.
There is a clear emphasis on the overall technical aspect, but there are also trade-offs in this approach.
RSI is approaching overbought levels, and the macroeconomic backdrop is not entirely bearish: the market still regards a December interest rate hike as the baseline scenario, with U.S. Treasury yields remaining high. Traders hope to see daily closes above $87,354, and for ADX to remain strong, they will consider it a true breakthrough; meanwhile, the Federal Reserve's meeting on October 28th will be the next important macroeconomic test.
Disclaimer
The views and opinions expressed by the author are for informational purposes only and do not constitute financial, investment, or other advice.