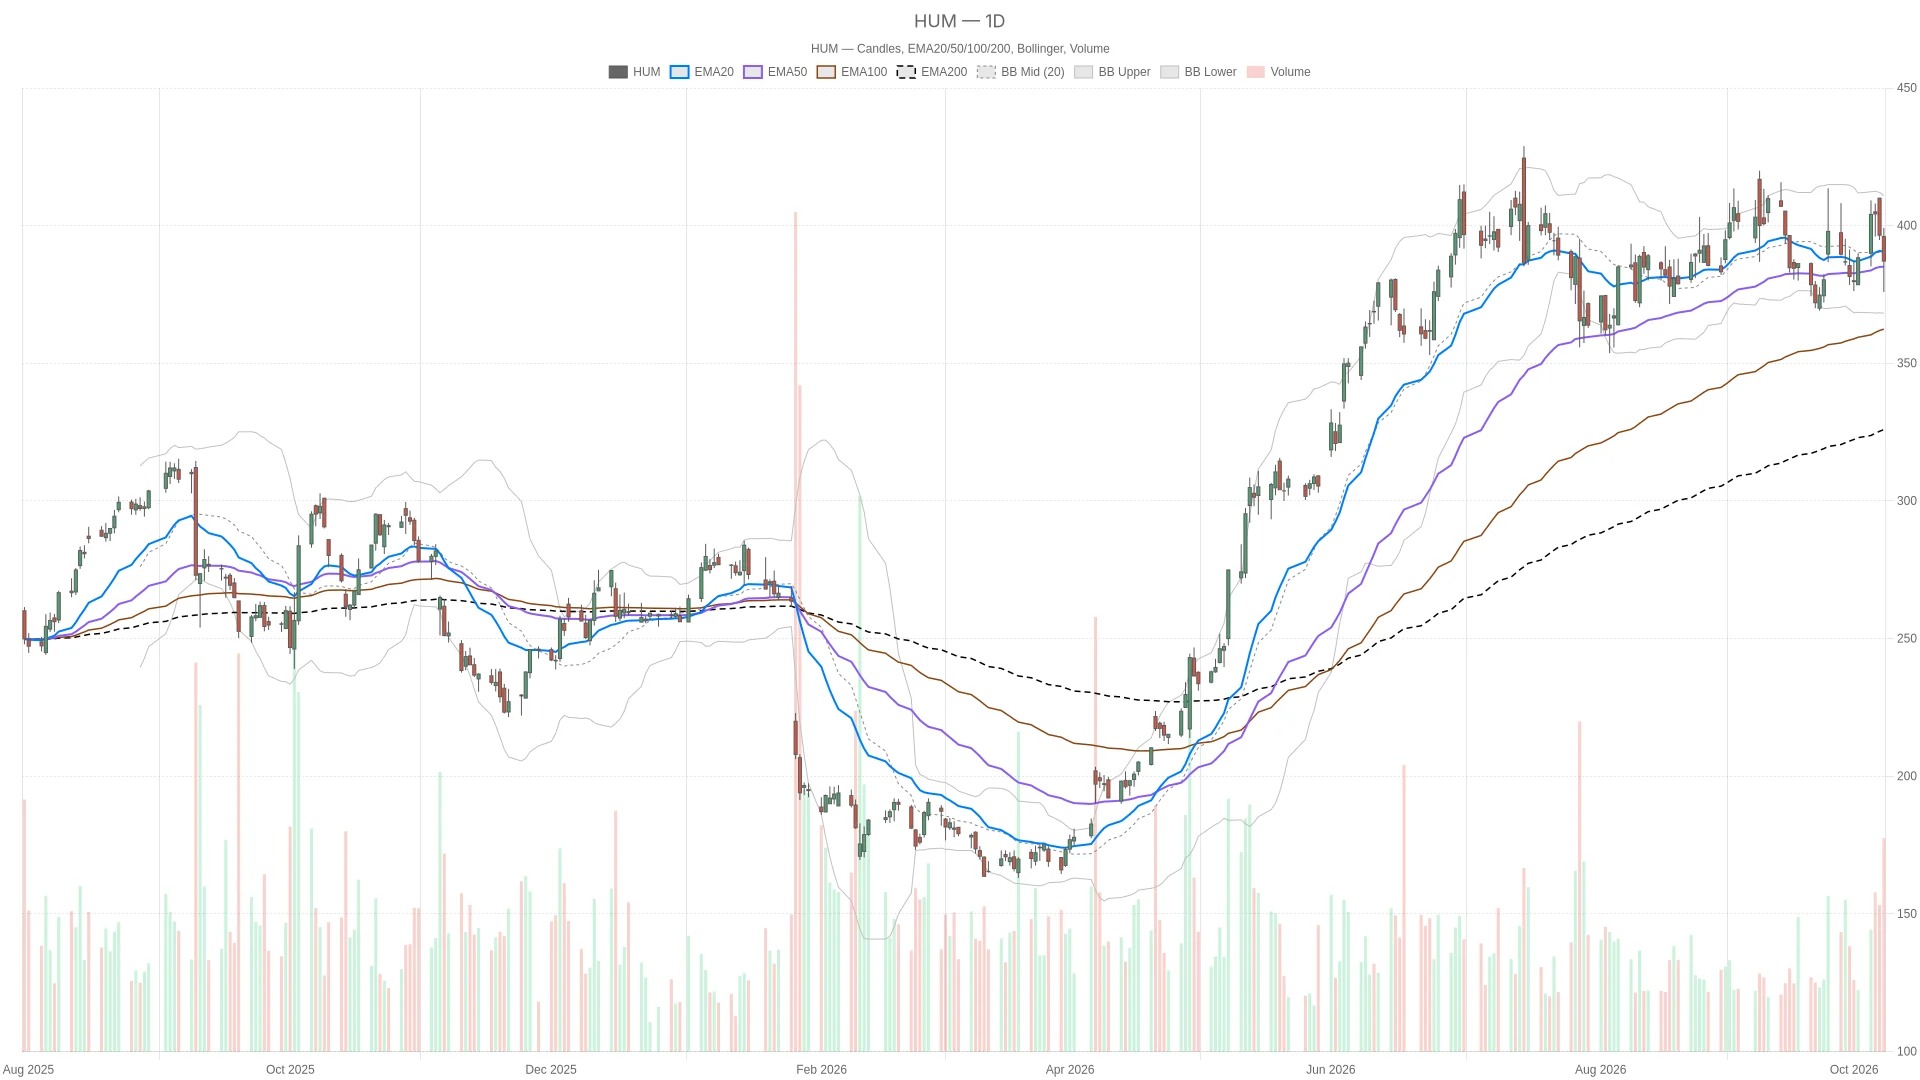
The daily chart of Humana shows a neutral trend, closing at $387.12 on Thursday, which is lower than the level over the past 20 trading days of EMA, but higher than the level over the past 50 trading days of EMA. However, the hourly chart indicates bearish pressure.
On Thursday, October 8, 2026, Humana opened at $396.03, hit a low of $375.86 during the session, and a high of $399.19, before closing at $387.12. The previous trading day's closing price was $396.51. The trading volume was 2,658,300 shares. Prices and technical indicators are provided by Twelve Data.
Key Points
- Humana closed at $387.12 on Thursday, lower than the 20-day EMA ($390.48), but higher than the 50-day EMA ($385.1).
- The daily line RSI14 is at 48.33, which is below the neutral level of 50; the daily line MACD bar chart shows a positive value of 0.79, and the MACD line at 1.2 is higher than the signal line at 0.41.
- Hourly chart is bearish: The price is below the three-hour EMA; the hourly RSI14 level is 44.05, and the hourly MACD line is -2.25, which is lower than the signal line of -0.3.
- On the daily chart, ATR14 rose from $14.02 on the previous trading day to $14.69.
- Yahoo Finance reported after the close on Thursday that Humana's highest Medicare Advantage contract rating had been raised from 3.5 to 4 stars; Investing.com reported on Friday that 95% of Medicare members were in plans with a rating of 4 stars or above.
Humana Stock Price: Daily chart is neutral, with conflicting momentum signals
The closing price is below the 20-day EMA of 390.48 US dollars, but above the 50-day EMA of 385.1 US dollars. The 200-day EMA is at 326.85 US dollars. This arrangement indicates resistance above in the short term, but the medium-term moving average still provides support; it is not a completely bullish arrangement.
However, the daily momentum is not consistently bearish. The RSI14 value is 48.33, which is below the neutral threshold of 50. The MACD line is 1.2, which is higher than the signal line of 0.41, and the bar chart shows a positive value of 0.79. Therefore, despite the relatively weak RSI reading, the MACD still retains a positive signal.
The middle band of the daily Bollinger Bands is at $389.53, which is also above the closing price. The lower band of the Bollinger Bands is at $368.18, and the upper band is at $410.88. This adds a factor of caution regarding volatility to the current trend, which lacks a clear and consistent direction.
The hourly chart shows weakness, limiting the bullish interpretation of Humana.

In contrast, the support on the hourly chart is weaker. The closing price is below these three hourly moving averages: the 200-hour EMA is at 389.89 USD, the 50-hour EMA is at 392.11 USD, and the 20-hour EMA is at 392.43 USD. Although the price is below these three moving averages, the 20-hour EMA is still higher than both the 50-hour and 200-hour EMA.
The hour RSI14 is at 44.05, which is below 50. The MACD line is at -2.25, below the signal line of -0.3, and the bar chart shows -1.96. This negative hourly signal weakens the positive reading of the daily line MACD, keeping the overall tone neutral rather than bullish.
At the same time, the 15-minute chart provides only a reference at the execution level. The closing price is higher than the 20-week EMA of $386.69, but lower than the 50-week EMA of $390.92 and the 200-week EMA of $392.34. The RSI14 is at 49.2, which is below 50. Its MACD line is at -1.68, higher than the signal line of -2.53, and the bar chart shows a positive value of 0.86. However, this short-term signal cannot offset the weakness shown in the hourly chart.
Medicare Rating reports are part of the subsequent news context.
A report published by Yahoo Finance after the close on Thursday stated that Humana's largest Medicare Advantage contract covers over 2 million members, with its rating rising from 3.5 to 4 stars, which is now above the bonus threshold.
On Friday, October 9th, Investing.com reported that 95% of the Humana members were enrolled in plans with a rating of 4 stars or above. Another report on Friday linked the rise in stock prices to the Evercore improvement of Medicare Star Ratings. A report by Reuters, reprinted by Investing.com, stated that Humana would be the biggest beneficiary of the 2027 Medicare star rating.
Investing.com also reported that the pre-market increase on Friday was 15%, and mentioned an upgrade of Medicare. These are the subsequent pre-market figures from that media, not the returns during the trading session on Thursday, nor are they the updated chart prices. The aforementioned reports were all published after the trading session on Thursday.
Humana Bull and Bear Conditions for Stock Prices
When trading resumes next time, the daily pivot point is at $387.39, the first resistance level is at $398.92, and the first support level is at $375.59. These levels are calculated based on the completed daily candles and are applicable for the next trading session.
To maintain a bullish outlook, it is necessary to hold above the 50-day EMA of 385.1 USD and break through the daily pivot point of 387.39 USD. Above that, the middle band of the Bollinger Bands at 389.53 USD and the 20-day EMA of 390.48 USD will constitute consecutive resistance levels. If these levels can be sustained, and at the same time the hourly MACD line is above the signal line, it will support a stronger bullish interpretation. By then, the first daily resistance level of 398.92 USD will become the next reference point.
On the contrary, if it falls below the 50-day EMA of $385.1, that would weaken this bullish scenario. The intraday low of $375.86 came before the first support level of $375.59 on the daily chart, followed by the lower band of the Bollinger Bands at $368.18. For the short-term timing after trading resumes, the 15-minute pivot point is $386.63, with the first resistance level at $388.89 and the first support level at $385.07.
Overall, the closing price of $387.12 is situated between the daily support level of $385.1 ($EMA) and the resistance level of $390.48 ($EMA). The volatility, at $14.69, remains a key factor in the assessment. The unresolved question is whether subsequent news ($Medicare) will enable the price to break through the upper resistance level on the chart.
Frequently Asked Questions
Humana What is the daily trend structure of the stock price?
The daily chart of Humana is neutral. The closing price on Thursday was $387.12, which is lower than the 20-day EMA of $390.48, but higher than the 50-day EMA of $385.1. The daily RSI14 is at 48.33, below the neutral 50 level; however, the MACD still maintains a positive signal. The MACD line is at 1.2, higher than the signal line of 0.41, and the bar chart shows a positive value of 0.79.
What does the star rating report Medicare say?
A report released after the close on Thursday by Yahoo Finance stated that Humana's largest Medicare Advantage contract covered over 2 million members, with its rating rising from 3.5 to 4 stars, which is now above the bonus threshold. On Friday, October 9th, Investing.com reported that 95% of Medicare members were enrolled in plans rated 4 stars or higher. All of these reports were published after that trading period.
Humana What key levels should be watched for stock prices?
The daily pivot point for the next trading session is $387.39, with the first resistance level at $398.92 and the first support level at $375.59. The 50-day EMA at $385.1 and the 20-day EMA at $390.48 are key reference levels. The middle band of the Bollinger Bands is at $389.53, the lower band at $368.18, and the upper band at $410.88. The daily ATR14 is at $14.69.
Cryptonomist and the author do not hold any positions in the financial instruments mentioned in this text, nor have they received any compensation from the companies reported.
This article was generated with the assistance of artificial intelligence and has been reviewed by an editorial team.