Mobile-health Network Solutions ( MNDR ) is above the key moving averages, with a bullish bias on the daily chart, but signals on shorter time frames are still divided. The daily RSI is in an overbought area, and the 15-minute MACD bar chart shows negative values. This means that whether the bullish scenario will hold true before the trading session ends depends on whether the support level can be maintained.
Abstract
Key Points

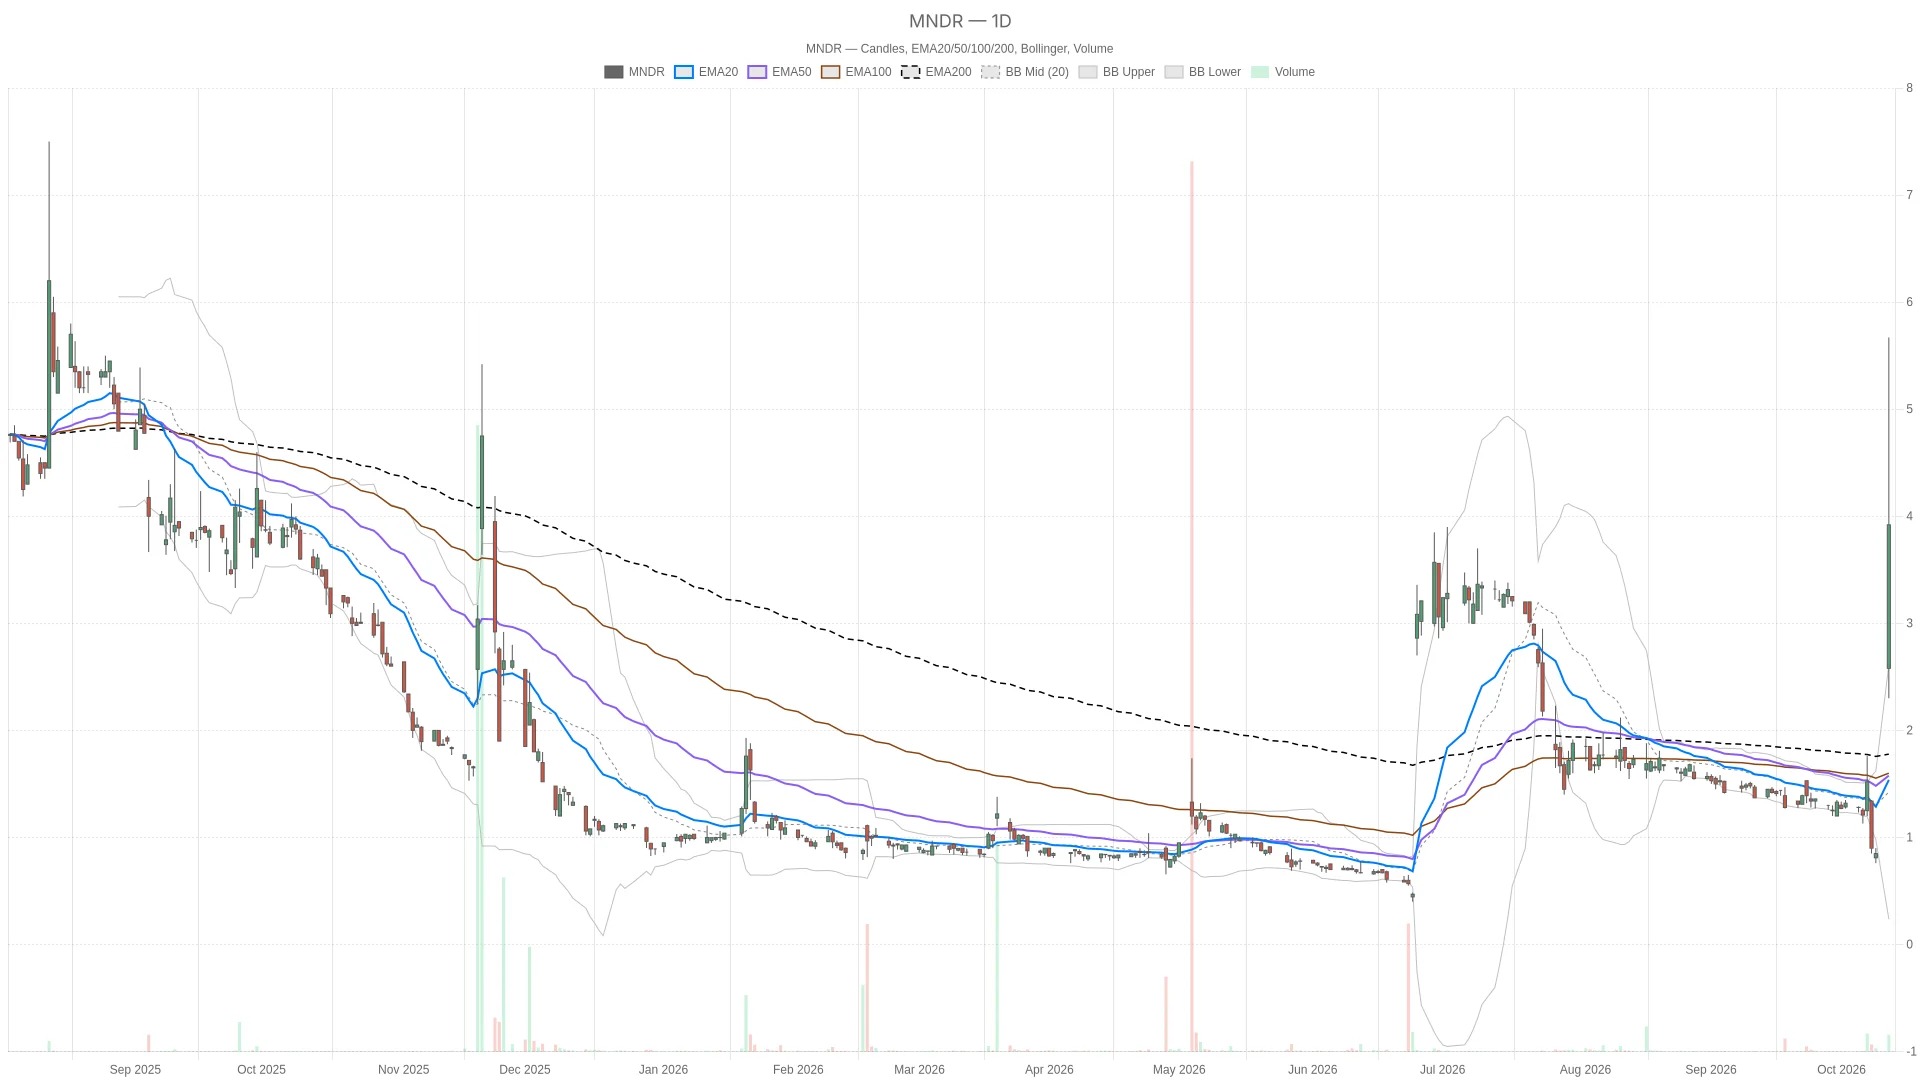
- The stock price is above the 20-day EMA (US$1.54), 50-day EMA (US$1.58), and 200-day EMA (US$3.22) moving averages, but these EMA patterns have not yet formed a bullish arrangement.
- The daily line RSI14 is at 78.57, which is in the overbought area; the daily line MACD bar chart shows 0.16, which is still a positive value.
- The 15-minute MACD bar chart shows a value of -0.12, and the MACD line (0.41) is below the signal line (0.53).
- To continue rising, it is necessary to break through the first resistance level of $3.98 at the hourly time frame, as well as the pivot level of $4.03 at the 15-minute time frame.
On Monday, October 12, 2026, MNDR opened at $2.58, with a low of $2.3 and a high of $5.67 during the session. As of 2:58 PM Eastern Time, the stock price was at $3.92, representing a 361.18% increase from the previous day's closing price. The current trading volume is 2,103,020 shares. Since trading for the day has not yet concluded, the daily chart indicators include K-lines that are still forming. MNDR opened at $2.58 and fluctuated between $2.30 and $5.67 during the session, with the latest price at $3.92; the previous closing price was $0.85.
Mobile-health Network Solutions: The daily chart is strengthening, but the trend has not yet fully resonated.
Daily Line EMA and Trend Structure
The 20-day moving average EMA is at $1.54, the 50-day moving average EMA is at $1.58, and the 200-day moving average EMA is at $3.22. The stock price is above these three moving averages, which supports a bullish outlook. However, the 20-day moving average is still below the 50-day moving average, and the 50-day moving average is below the 200-day moving average; this does not constitute a complete bullish EMA pattern.
Daily Line Momentum and Volatility Context
At the same time, the daily line RSI14 is at 78.57, which is in the overbought area. The daily line MACD is at 0.1, which is higher than the signal line of -0.06, and the bar chart shows a positive value of 0.16. This relationship supports a bullish scenario, while RSI more reflects that the increase has been amplified, but it does not alone constitute a bearish signal.
The stock price is still above the upper band of the daily Bollinger Bands at $2.61, with the middle band at $1.42 and the lower band at $0.24. The current position indicates that MNDR has moved beyond the upper boundary of this channel. The daily ATR14 has risen from $0.18 to $0.52 from the previous candlestick, indicating an increase in measurable volatility. The daily pivot point is at $0.84, the first resistance level is at $0.91, and the first support level is at $0.77, all of which are below the current stock price. These levels are calculated based on the previous completed daily candlestick and are applicable to the current trading period.
Strong confirmation at the hourly level, but execution signals are divergent.
Hourly Trend and Momentum
On the hourly chart, MNDR is above the 20-hour EMA level of $2.32 and the 50-hour EMA level of $1.73, as well as above the 200-hour EMA level of $1.5. The arrangement of these moving averages forms a bullish structure. The hourly RSI14 is at 69.52, which is still below the overbought threshold. The MACD line is at 0.7, which is higher than the signal line of 0.4. Nevertheless, the hourly MACD bar chart shows a decrease from 0.32 to 0.3 from the previous candlestick, indicating that the positive difference has narrowed.
The current stock price is above the hourly pivot point of $3.47, but below the first hourly resistance level of $3.98. The first hourly support level is $3.09. MNDR is also above the middle band of the hourly Bollinger Bands at $1.82, but below the upper band at $4.74. The hourly ATR14 is at $0.67, providing a range for fluctuations in these neighboring price levels.
15-minute execution signal
In contrast, the 15-minute chart makes it more complex to determine the timing of entry, but it does not overturn the overall bullish trend on the daily chart. The stock price is still above the EMA levels, which are 3.51 USD, 2.67 USD, and 1.69 USD respectively. However, MNDR is below the 15-minute Bollinger Band middle band of 4 USD, as well as below the 15-minute pivot point of 4.03 USD. RSI14 is at 56.95, which is above the neutral level, but MACD is 0.41 below the signal line of 0.53. A negative bar chart showing -0.12 indicates that the short-term confirmation is not yet complete. The first support level on the 15-minute chart is 3.65 USD, the first resistance level is 4.63 USD, and ATR14 is at 0.62 USD.
Bullish and bearish conditions
To continue the upward trend, the stock price needs to first break through the first hourly resistance level of $3.98, followed by reaching the 15-minute middle band of $4 and the pivot point of $4.03. If these levels can be maintained, it will strengthen the short-term confirmation. Looking further ahead, the relevant resistances include the first 15-minute resistance level of $4.63, as well as the upper band of the 15-minute Bollinger Bands at $4.74.
On the contrary, if it falls below the first support level of $3.65 for the 15-minute period, the short-term trend will weaken. At that time, the hourly pivot level of $3.47 will become the next reference point. If it continues to fall below the daily 200-period EMA level of $3.22, then the bullish logic based on support levels will no longer hold. The first hourly support level is at $3.09, which is below that level.
Overall, Mobile-health and Network Solutions are currently above their daily moving averages, but still below the nearby resistance levels, namely the first hourly resistance level of $3.98 and the 15-minute pivot level of $4.03. The readings for ATR highlight the volatility in these price areas. The unresolved issue is whether the short-term confirmation can match the bullish position on the daily chart before the trading session has ended. The price and technical indicator data are from Twelve Data.
Frequently Asked Questions
What are the key resistance levels for MNDR?
The recent resistance levels include the first hourly resistance level of $3.98, followed by the 15-minute Bollinger Band middle band at $4.00 and the 15-minute pivot point at $4.03. Further up, the first 15-minute resistance level is at $4.63, and the hourly Bollinger Band upper band is at $4.74.
Mobile-health Network Solutions What does a daily value of RSI at 78.57 mean?
The daily line RSI14 is at 78.57, which indicates that MNDR is in an overbought area, above the threshold of 70. The article points out that this reflects an increase that has been amplified, but it does not in itself constitute a bearish signal.
Which support levels should traders pay attention to for MNDR?
The first support level in 15 minutes is at $3.65. If it falls below this level, the hourly pivot point of $3.47 will become important, followed by the daily 200-period EMA level of $3.22, and then the hourly first support level of $3.09. If it continues to fall below the daily 200-period EMA level of $3.22, the bullish logic will weaken.
Neither Cryptonomist nor the author holds any positions in the financial instruments mentioned in this text, nor have they received any compensation from the companies reported.
This article was generated with the assistance of artificial intelligence and has been reviewed by an editorial team.