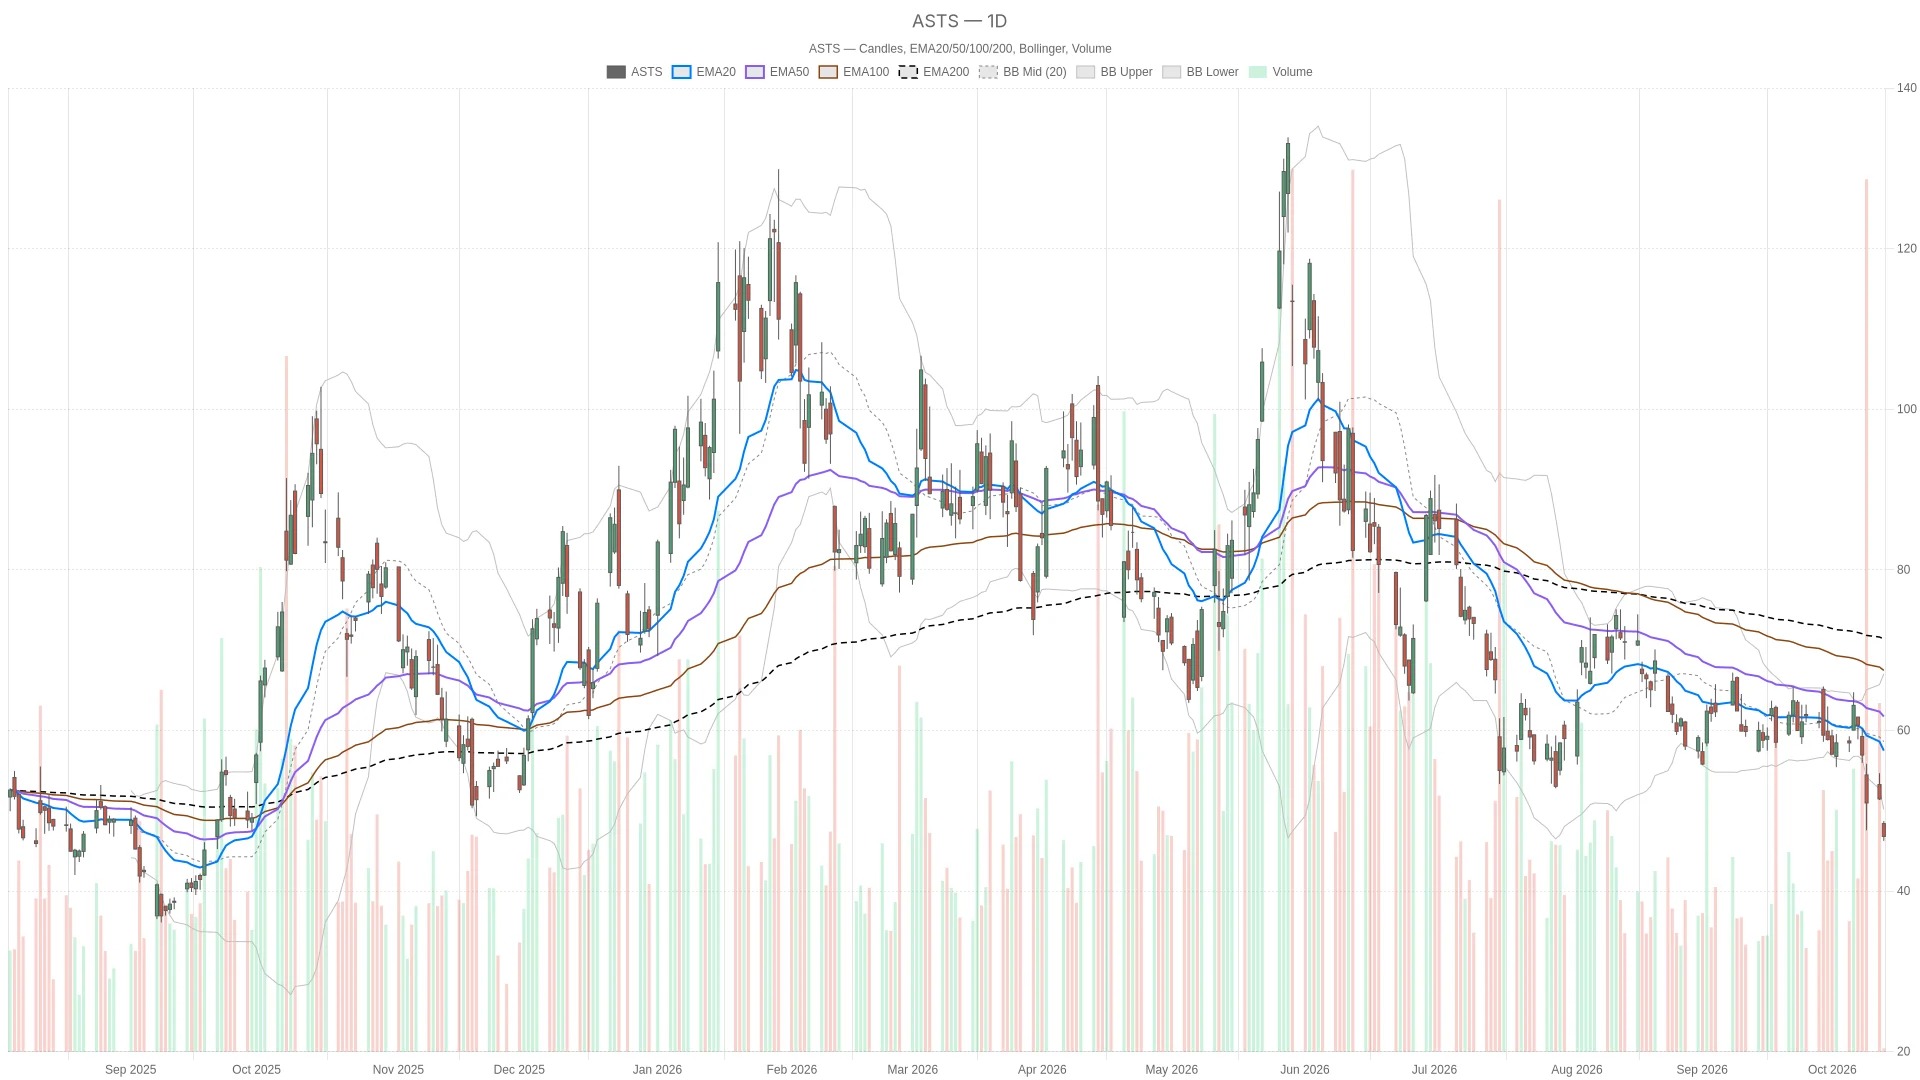
ASTS stock shows a bearish daily chart pattern, with the price of AST SpaceMobile below all three daily moving averages and the lower band of the Bollinger Bands. The hourly chart also confirms this bearish trend. However, oversold readings during trading hours complicate the judgment of short-term trading opportunities, but they do not provide any basis for a bullish outlook.
Key Points
- As of 10:42 a.m. Eastern Time on Tuesday, the stock price of ASTS was reported at $46.795, a decrease of 9.07% from the previous trading day's closing price of $51.46.
- The daily line RSI14 is at 31.76, which is above the oversold threshold of 30. The daily line MACD is at -2.74, which is below the signal line of -1.62, and the bar chart shows -1.12.
- The price is below the lower band of the daily Bollinger Bands at $50.15, as well as below the first daily support level ($50.3).
- The hourly RSI14 is at 28.20, which is in an over-sold range. The 15-minute RSI14 is also at 19.16, which is likewise in an over-sold range.
- The price is higher than the 15-minute pivot point of $46.47, but lower than the hourly pivot point of $47.09.
On Tuesday, October 13, 2026, the trading session opened at $48.40, fluctuated between $46.24 and $48.72 during the day, and was last reported at $46.80, compared to a previous closing price of $51.46. ASTS As of 10:42 Eastern Time, it was reported at $46.795, a decrease of 9.07% from the previous closing price. The previous closing price of $51.46 was recorded on October 12, 2026. To date, the trading volume for this session is 203,096 shares. Prices and technical indicators are provided by Twelve Data.
ASTS Stock: Daily chart structure indicates a bearish trend has been established

The daily moving averages are clearly bearish: the price is below the 20-day EMA at $57.48, followed by the 50-day EMA at $61.73. The 200-day EMA is even higher, at $70.32. This arrangement supports a bearish outlook, and it's not just about the price being below a certain moving average.
Meanwhile, on the daily chart, RSI14 has dropped from 36.69 on the previous trading day to 31.76, approaching the oversold area, but it is still above 30. On the daily chart, MACD is at -2.74, which is lower than the signal line of -1.62. The bar chart has also decreased from -0.71 to -1.12, with a negative gap between the line and the signal line.
The price is also below the lower band of the daily Bollinger Bands at $50.15. The middle band is at $58.6, and the upper band is at $67.06. This position further reinforces the downward imbalance, but it does not mean that a rebound is imminent. The daily ATR14 indicator is at $4.53, which only provides a reference for volatility and does not constitute a directional signal.
It is worth noting that the price is below the first daily support level of $50.3 ($S1), as well as below the daily pivot point of $52.48. The first daily resistance level ($R1) is at $53.65. These levels are derived from the previous completed daily candlesticks and are applicable to the current trading session; currently, S1 is located above the price, rather than serving as a support level below it.
Hourly chart confirmed, but short-term signals are mixed.
The hourly moving averages are also in a bearish alignment. The price is below the 20-hour EMA at $52.16, the 50-hour EMA at $55.25, and the 200-hour EMA at $59.7. The hourly RSI14 has risen from $26.78 of the previous candlestick to $28.2, but it is still in an oversold state.
Contrary to the rise of RSI, the hourly MACD bar chart has dropped from -0.13 to -0.3. The MACD line is at -2.22, still below the signal line of -1.92. The signals at these indicator levels are somewhat mixed, but none of them overturn the bearish structure on the daily chart.
The price is between the lower band of the hourly Bollinger Bands at $45.7 and the middle band at $51.92. It is below the hourly pivot point of $47.09 and the first resistance level ($R1) at $47.95, but above the first support level ($S1) at $45.47. The hourly ATR14 is at $1.54. The hourly pivot level is derived from the previous completed hourly candlestick.
From an execution perspective, the price is above the 15-minute pivot point of $46.47 and the first resistance level ($R1) of $46.71. However, it is still below the 20-quarter-hour ($EMA) level of $50.17. The 15-minute RSI14 indicator is in an oversold state at 19.16, while the MACD bar chart shows -0.71, which remains negative. The price is also above the lower band of the Bollinger Bands at $46.14 and the first support level ($S1) of $46.09. The 15-minute ATR14 indicator is at $0.77; its pivot level is determined using the previous completed 15-minute candlestick.
Recent reports on competition and valuation concerns
A report published before the opening on Tuesday Yahoo Finance linked about a 5% pre-market decline with a downgrade of Piper Sandler. The report mentioned intensified competition in SpaceX and possible limitations on the availability of satellite launches. This pre-market fluctuation is separate from the decline during the current trading session.
In addition, Yahoo Finance questioned in the pre-market valuation commentary whether the assets on AST SpaceMobile's balance sheet were sufficient to support its valuation. Another pre-market report by Yahoo Finance stated that AST's upcoming acquisition of the Ligado spectrum usage rights is still subject to approval and delivery conditions. These are all concerns and conditional developments, not completed results.
Bullish and bearish scenarios
A bullish scenario requires the price to hold above the 15-minute pivot point of $46.47 and to break through the hourly pivot point of $47.09. The next upper reference level is the hourly R1 of $47.95. If these levels can be broken through, the short-term bullish foundation will be strengthened, but the daily resistance remains key. Subsequently, it is necessary to re-establish itself above the lower band of the daily Bollinger Bands at $50.15 and the S1 of $50.3 before facing the daily pivot point of $52.48 again.
On the contrary, if it falls below the 15-minute pivot point of $46.47, the bullish scenario will be weakened. After hitting a lower low of $46.24 during the session, the lower band of the 15-minute Bollinger Bands at $46.14 and S1 at $46.09 will become the next set of reference levels. The lower band of the hourly Bollinger Bands at $45.7 and S1 at $45.47 will serve as subsequent downward references.
Overall, the stock price of ASTS is higher than the nearby quarter-hour level, but lower than the hourly pivot point and key daily reference levels. The reading for ATR provides a measure of volatility across three time frames. Whether the oversold readings during the session will be accompanied by a sustained strengthening remains unanswered at this time, as the trading period is still in progress.
Frequently Asked Questions
What was the stock price of ASTS on Tuesday?
As of 10:42 a.m. Eastern Time on Tuesday, October 13, 2026, the stock price of ASTS was reported at $46.795, representing a decrease of 9.07% from the previous closing price of $51.46 on October 12, 2026. The trading session opened at $48.4, with a low of $46.24 and a high of $48.72 during the day.
What do the daily technical indicators of ASTS show?
The daily line RSI14 is at 31.76, which is close to but still above the oversold threshold of 30. The daily line MACD is at -2.74, below the signal line of -1.62, and the bar chart shows -1.12. The price is also below the 20-day EMA of $57.48, the 50-day EMA of $61.73, and the 200-day EMA of $70.32, as well as below the lower band of the daily Bollinger Bands at $50.15.
Where does ASTS stand relative to the key support level?
The price is above the 15-minute pivot point of $46.47 and the intraday low of $46.24. Further below are the 15-minute Bollinger Band lower band at $46.14 and the 15-minute S1 at $46.09. The hourly Bollinger Band lower band is at $45.7, and the hourly S1 is at $45.47. On the daily time frame, the price is below the S1 of $50.3 and the daily pivot point of $52.48.
What are the bullish conditions for ASTS?
A bullish scenario requires the price to hold above the 15-minute pivot point of $46.47 and to break through the hourly pivot point of $47.09. The hourly R1 of $47.95 is the next upper reference level. Subsequently, it is necessary to re-cross above the lower band of the daily Bollinger Bands at $50.15 and the daily S1 of $50.3 before entering the discussion range for the daily pivot point of $52.48.
Cryptonomist and the author do not hold any positions in the financial instruments mentioned in this text, nor have they received any compensation from the companies reported.
This article was generated with the assistance of artificial intelligence and has been reviewed by an editorial team.