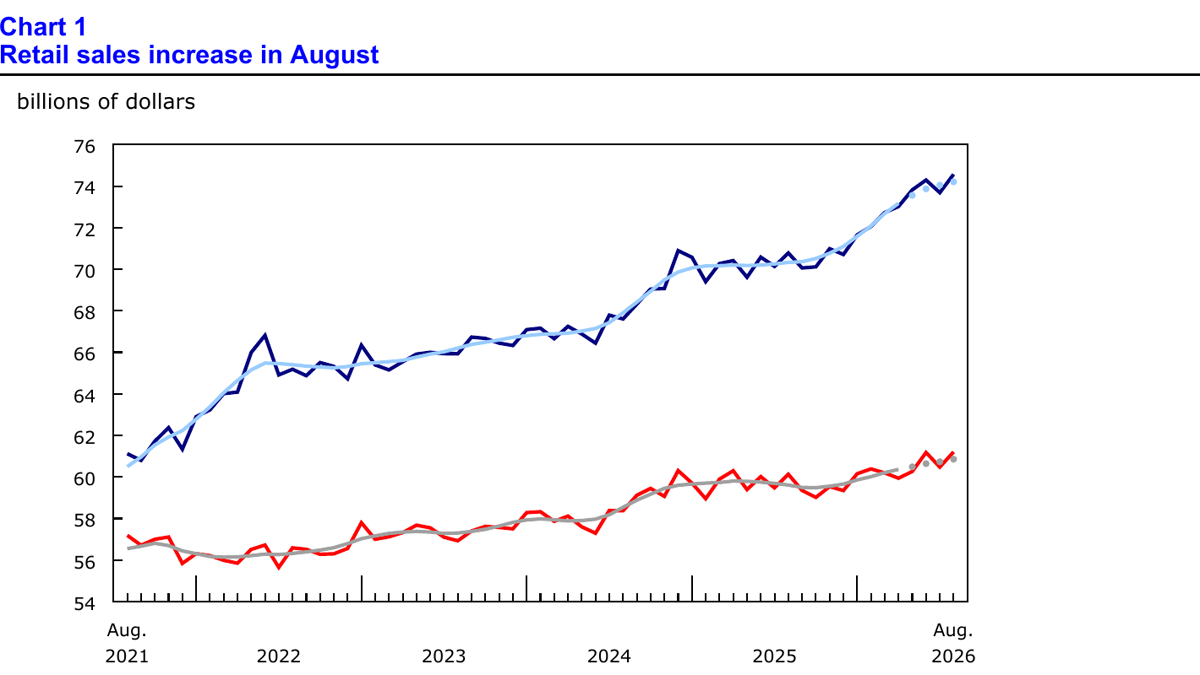


The Canadian Statistics Agency released retail sales data for August on October 23, showing that seasonally adjusted retail sales increased by 1.2% month-on-month to approximately C$74.6 billion. All nine sub-sectors of statistics recorded growth, with auto and parts dealers being the main contributors; core retail, excluding automobiles and gas stations, also saw a 1.1% month-on-month increase. Calculated based on sales volume, retail sales also grew by 1.2%. Both the nominal amount and the quantity after excluding price effects increased, making this data more than just a story of higher prices driving sales. However, it remains a monthly, preliminary industry survey.
The value of this report lies in breaking down the question "Has consumption improved?" into several measurable aspects: Is the growth concentrated in automobiles or has it spread to other goods? Does the increase in amount come alongside an actual increase in purchases? Is there a consistent trend across different provinces? And will the figures for the most recent month be revised in subsequent surveys? If one only focuses on the headline of 1.2%, it is easy to mistake a temporary monthly rebound for a confirmed trend of economic growth; however, if one only looks at the total amount, then factors such as prices, product categories, and regional distribution are overlooked.
Automobile sales are clearly on the rise, but core retail is also making a comeback.
The Bureau of Statistics pointed out that sales by automobile and parts dealers increased by 1.2% month-on-month, with new car dealers experiencing a 1.5% increase, reversing the decline seen in July; however, used car dealers saw a 0.5% decline. Sales amounts at gas stations and fuel suppliers increased by 1.7% month-on-month, marking the first growth in three months, but when measured by volume, sales actually decreased by 0.5%. This contrast reminds readers that an increase in fuel sales amounts cannot be directly equated with an increase in fuel consumption; prices and quantity need to be considered separately.
Core retail excludes automobiles, as well as gas stations and fuel suppliers, allowing for a more comprehensive observation of daily consumer spending on goods. In August, this indicator grew by 1.1%, compared to a decrease of 0.7% in the previous month. Food and beverage retailers saw a 1.1% increase, marking the first rise in three months; department store and general merchandise retailers grew by 1.0%, while health and personal care retailers experienced a 1.6% increase, which is the tenth consecutive month of growth for the latter category. The overall recovery across categories indicates that growth is not solely due to a single large automobile transaction, but changes in household budgets behind these various types of goods still need to be verified over multiple months.
From a quantitative perspective, official reports indicate that total retail sales actually increased by 1.2%. This provides stronger support for an improvement in consumption levels. However, the quantity data is adjusted using a price index and does not involve a physical inventory of each item; sample selection, price deflation, and seasonal adjustments may all lead to subsequent revisions. For those analyzing household demand, both nominal sales and actual sales being positive is a sign, but it does not necessarily imply that wage purchasing power, savings, or consumer confidence have also improved simultaneously.
Regional differences represent another layer of testing. In August, retail sales increased in six provinces: Ontario saw a growth of 2.2%, which was a significant contribution to the total amount, with the Greater Toronto Area experiencing a 4.0% increase; British Columbia also had a 2.1% growth, as did the Vancouver metropolitan area. Alberta, however, saw a slight decline of 0.1%, mainly due to weaker sales of automobiles and parts. National data tend to mask these regional disparities, so a retailer operating across provinces cannot simply use the national average growth rate as a forecast for customer traffic at its local stores.
E-commerce grew by 1.1% on a quarter-on-quarter basis after seasonal adjustment, amounting to approximately C$5.6 billion, accounting for 7.6% of the total retail sales. This proportion indicates that online channels have established a stable position in commodity retail, but it cannot be interpreted as the online share of all residents' consumption; travel bookings, ticketing, and some financial transactions are not included in this retail category. It is important to clarify the statistical boundaries to avoid mistaking a survey of one industry for a complete account of consumer spending.
Can the September leading indicators continue this rebound?
The report also provides an early estimate for September retail sales: there may be a 0.7% increase month-on-month. The Bureau of Statistics specifically notes that this is an informal preliminary indicator, calculated based on responses from 58.5% of enterprises at that time; the final average response rate for surveys over the past twelve months was 86.8%. Therefore, 0.7% can serve as a clue for observation in the following month and should not be taken as the official result for September. As more samples are collected and revised, the growth rate may even change. The official data for September is scheduled to be released on November 20th, which will be the appropriate time to compare it with the results from August.
Macroeconomic judgments also need to take into account statistical calibers. Unless otherwise specified in this report, data is presented in current-period Canadian dollars and after seasonal adjustment; comparisons of the same month across different years, month-over-month changes, and quantitative indicators should not be mixed together. In August, nominal retail sales increased by 5.4% year-on-year, but this does not mean that residents' actual purchasing volume also increased by 5.4% year-on-year. To assess the contribution of Canadian consumption to quarterly economic growth, it is also necessary to consider service consumption, price changes, population, and other national account information, as retail sales are just a part of the overall consumption picture.
For policy observers, this data provides evidence that demand remains resilient, but it does not determine the interest rate path on its own. Central banks are more concerned with the combination of consumption and inflation, employment, and output; a one-month increase in retail sales does not necessarily indicate overheating demand, especially when there are differences in performance across provinces and product categories. It is very risky for investors to directly translate 1.2% into the next policy action, ignoring the intermediate information on prices and economic activity.
The most solid conclusion from the August report is that Canadian retail sales did indeed expand month-on-month, with a wide range of growth and a corresponding increase in actual volumes. The next step is to see whether the official results for September will continue this trend, how the preliminary figures from early August will be revised, and whether the differentiation between core retail sectors and regions will remain. Distinguishing between a “month-on-month rebound” and a “sustained recovery” is key to understanding these data.
For actual operators, it is also necessary to compare the statistical results with store orders, inventory turnover, and return rates. An increase in national retail sales may stem from the concentrated delivery of certain high-value categories, which does not necessarily mean that the average transaction value per customer and foot traffic in each store have improved simultaneously. If inventory accumulation or increased discounts occur subsequently, the profit significance of that month's sales growth will also change. Macroeconomic data provide a direction, while corporate financial reports and subsequent investigations can then complement the assessment of operational quality.