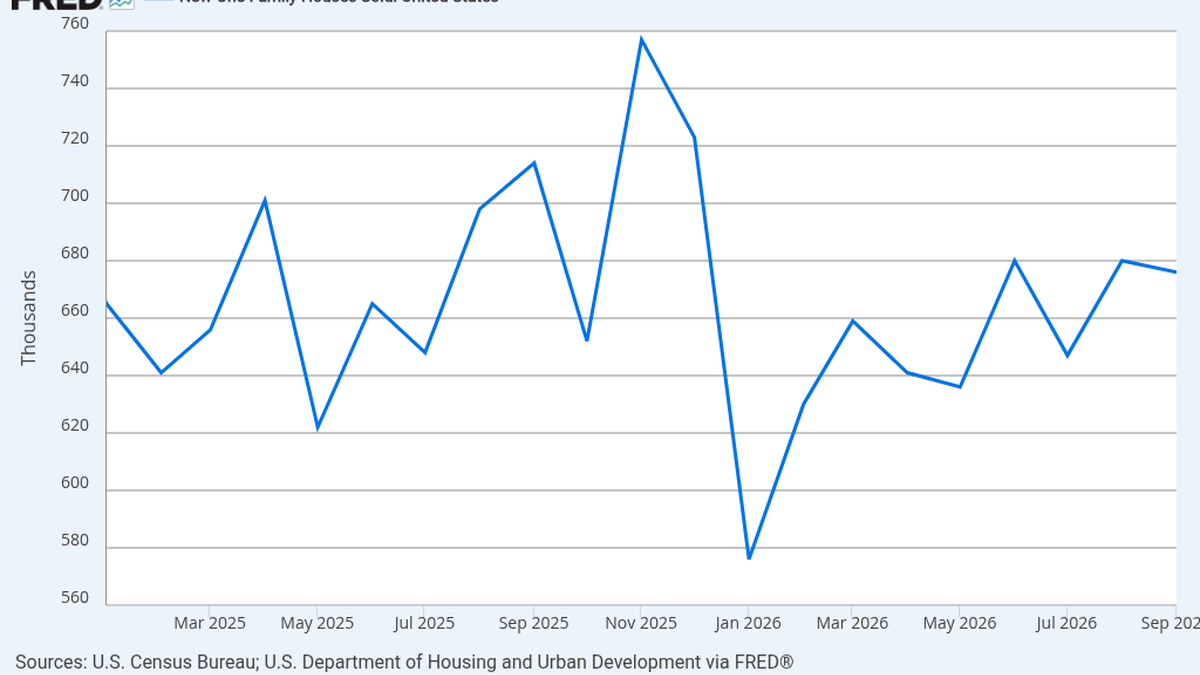


On October 27, the U.S. Census Bureau and the Department of Housing and Urban Development announced that the seasonally adjusted annualized sales volume of new single-family homes in September was 676,000 units, which is 0.6% lower than the revised figure of 680,000 units in August and 5.3% lower than in September 2025. The term “decline” in the headline is accurate, but the most important note about this set of data lies within the margin of error: the official error range for month-over-month changes is plus or minus 13.8 percentage points, and for year-over-year changes it is plus or minus 12.5 percentage points, both of which are greater than the estimated decline. In other words, based solely on the monthly sales rate, it is difficult to assert that demand has significantly weakened. The market can discuss issues such as housing affordability, loan interest rates, and inventory pressures, but a 0.6% change in estimates should not be interpreted as a confirmed reversal of trend.
New home sales statistics are often regarded as a leading indicator of the real estate market, as contract signings can precede the completion of houses. However, this indicator does not equate to the actual delivery of homes for that month, nor does it represent the entire residential market. It only covers newly built single-family residences and does not include second-hand homes, nor does it directly reflect the financing costs for homebuyers or the concessions made by developers. The annualized rate is a conversion of the seasonally adjusted sales pace for that month into an annualized value; it does not mean that 676,000 units were actually sold in September. If readers wish to assess its economic significance, they must consider sales, inventory, prices, and previous data revisions together, and compare them with subsequent months, rather than using a single figure to represent the entire housing chain.
Different perspectives on inventory and selling prices
As of the end of September, officials estimated that there were 476,000 new homes available for sale, which is lower than the 481,000 units in August. Based on the sales pace at that time, these homes would last for 8.4 months to be sold out, compared to 8.5 months in August. Both the inventory level and the number of months required to sell them off have slightly decreased, indicating that there has not been a sudden backlog of homes that can be confirmed by a single month's data. However, these comparisons also have their own inaccuracies; particularly, the "number of months" depends on the sales pace, and changes in this factor can cause fluctuations in the time it takes to sell the inventory. A slight decrease in inventory does not necessarily mean strong demand; it could also be due to changes in the pace of new construction, completion, or listing of homes. If developers delay construction or adjust their product mix, the number of homes available for sale will change, but this does not necessarily mean that consumer purchasing power has improved accordingly. It is more prudent to consider changes in supply along with price trends, sales regions, and subsequent construction data when making interpretations.
The selling price cannot simply be regarded as a housing price index either. In September, the median price of newly sold homes was $400,400, which is about 3.9% higher than $385,400 in August and about 3.9% lower than $416,800 during the same period last year. The average selling price was $472,800, a slight increase of 0.4% from August and 6.7% lower than the same period last year. These figures represent a combination of homes sold in that month, not repeated price measurements for the same property. If the proportion of larger or more expensive homes sold increases in that month, the median price may rise, even if there has not been a general increase in prices for similar types of residences; conversely, the same is true. Officials also provide a significant sampling error for price changes, so it is not appropriate to infer from this that national new home prices have started to rise again. To determine price trends, it is also necessary to refer to longer time series, regional structures, and indicators that have been adjusted for quality.
The current data provides a common insight for developers and financial markets: there is still no clear one-way signal between orders and inventory. If one only focuses on the negative month-over-month sales figures, they may overlook the fact that inventory supply has not increased accordingly; similarly, if one only sees a rebound in the monthly median price, they may miss the fact that it is still lower than a year ago. The macro narrative tends to simplify the housing market as "a rebound occurs when interest rates drop," but actual decisions are also influenced by household income, down payments, insurance costs, taxes, land and construction costs, as well as regional population mobility. The announcement does not provide direct causal estimates for these variables. It is acceptable to use them as an explanatory framework, but they should not be presented as reasons that have already been proven by official data.
The next month is more important than this decimal place.
The residential sales data from the Census Bureau is subject to continuous revision as new reports and statistical processing are conducted. Therefore, the current August baseline is itself an estimated figure that has been revised. The range of errors in September's changes indicates that the next release and subsequent revisions will provide a better indication of the trend than the 0.6% mentioned in today's headline. Observers can pose three questions: Has the annualized sales rate consistently deviated from previous ranges? Have the levels of inventory for sale and the number of months it takes to sell those properties changed in the same direction? Does the change in selling prices mainly stem from specific transactions rather than a general increase or decrease? Only if these three factors continue to point in the same direction over several months can we make a more solid market assessment. If the indicators still cancel each other out, then the conclusion of "uncertain" should be maintained, rather than forcing a particular interpretation.
This report also needs to be distinguished from the indicators of the construction side. New home sales reflect the willingness to sign contracts, while commencement of construction and permits reflect the developers' future supply arrangements. Completion is closer to the actual supply that is put into effect. A weakening in front-end demand may first be reflected in sales, and then affect the commencement of construction; supply constraints may also first affect the choice of housing options, before altering selling prices and volumes. The chronological order of these events is not fixed, and monthly figures are more susceptible to the influence of weather, promotional activities, and statistical noise. For ordinary homebuyers, the most practical issues are still the availability of local housing and their own monthly mortgage payments, rather than the annualized rate across the country; for macro investors, the September data provide a point of observation, but it is not yet sufficient to independently support a definite conclusion that the housing market is "strengthening" or "weakening." Incorporating errors and revisions into the report is precisely the most basic form of respect for these indicators.
It should also be noted that the national average can mask regional differences. The supply of new homes and land costs vary greatly across different regions, and developers may also encourage signings by offering price reductions, upgraded configurations, or subsidies on loan interest rates. However, these incentives are not necessarily fully reflected in the listed prices. Even if the national sales rate continues to rise, some cities may still have high inventory levels; conversely, when national figures are weak, regions with limited supply may still maintain resilience. Therefore, homebuyers should not rely solely on national reports as a guide for local bargaining. A more cautious approach is to check the available properties in their area, actual transactions, developer incentives, and loan quotes, and to verify the months and statistical methods used for these data. Macro reports provide background information but do not replace due diligence in specific transactions.