











A single credit card statement can only show how much money a family has spent. However, when more than 350 million cards are combined, they can reveal the monthly pulse of consumption in the United States. On October 30th, staff from the Federal Reserve released a preliminary study that compared anonymous credit card data covering over 3,000 counties since 2014 with official personal consumption expenditure data on the same chart. The result was that the former could explain 92% of the fluctuations in the adjusted monthly consumption growth rate.
This figure makes credit card transactions appear like a faster macro indicator. Official consumption data often requires waiting and is subject to revision; however, card transaction information can reflect changes in restaurants, retail, travel, and online services more quickly. But the most noteworthy part of the research is not that "credit cards can predict consumption," but rather that the county-level results provide a set of suggestive evidence: after the impact of monetary tightening, the decline in consumption in low-income counties may be greater than in high-income counties. The authors emphasize clearly that this difference is not an accurate estimate, nor can it be directly interpreted as a definite cause-and-effect relationship for each low-income family.
The total amount is quite even, and the distribution has been separated between different counties.
Researchers organized the card data at the county level and compared it with the personal consumption expenditure indicators from the US Bureau of Economic Analysis. The coverage period starts in 2014, with a sample of over 350 million cards across more than 3,000 counties. After seasonal adjustments and other processing, this set of high-frequency data is highly synchronized with official monthly consumption changes, indicating that it captures not only the short-term fluctuations of customers from a single bank.
However, high synchronization does not mean that the two are exactly the same. Card-swiping data does not reflect cash payments, and it may also underestimate the population that does not use credit cards or other payment methods. The customer structure of different card-issuing institutions can also affect the sample. The significance of this research lies in using official statistics to calibrate these discrepancies, rather than replacing national accounts with a set of commercial data.
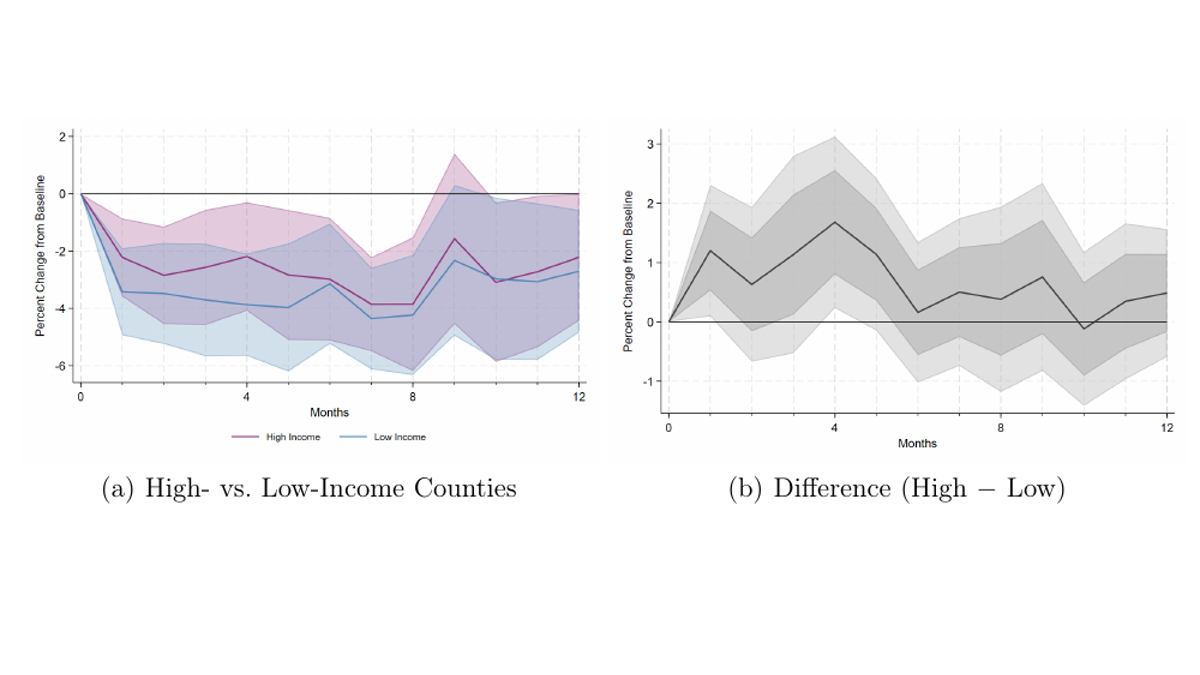
When researchers grouped counties by income, new information emerged. After the tightening of monetary policy, the decline in consumption was greater in low-income counties. While the national overall figure may only show a moderate slowdown, beneath that average, some regions cut back on non-essential expenses first, while others were still able to maintain their consumption levels. The impact of interest rates is not uniform; it has different effects depending on household assets, debt, and cash flow conditions.
Interest rate hikes are conveyed through bills rather than news headlines.
After policy interest rates are raised, families do not immediately change their lifestyles on the same day that the interest rate decision is announced. The impact is felt through changes in credit card interest rates, auto loans, housing financing, and business costs, before gradually affecting disposable income. A study observed in county-level data that the decline in consumption in low-income counties may be more significant after a monetary tightening shock; however, the classification of incomes at the county level is not sufficient for identifying causal relationships between households, and confidence intervals also suggest that there is still uncertainty regarding this difference.
This study does not attribute all changes in each county to interest rates, nor does it prove that all low-income families will reduce the same type of expenditure. County-level income is merely a characteristic of the population, and card transaction records cannot reveal the motivations behind individual purchases. What this research can support is a more cautious conclusion: within the study's framework, after monetary tightening, low-income counties exhibit a greater reaction in consumption, and average data tends to mask these distributional differences.
For policymakers, the use of such data is not about deciding whether to raise or lower interest rates with a single button, but rather about more quickly identifying where the effects are being felt. If overall consumption remains resilient, but there has been a significant cooling down in low-income areas, the marginal cost of further tightening cannot be measured solely by the national average. On the contrary, if spending continues to be strong in high-income areas, inflationary pressures may prove more stubborn than the slowdown in the overall volume suggests.
92% explanatory power does not equate to 92% prediction accuracy.
92% of what is under study can easily be presented as "credit card data can accurately predict 92% of consumption." This statement is incorrect. The official explanation is that this set of data explains 92% of the fluctuations in adjusted monthly personal consumption expenditure growth. It describes the degree of statistical synchronization, not that every individual transaction, every month, or future data will have a 92% accuracy rate.
It is important to distinguish between these two concepts. High relevance makes the data suitable for real-time monitoring, but it cannot eliminate sample bias, model selection, or changes in economic structures. Events such as pandemics, shifts in payment methods, or changes in the customer base of card-issuing institutions can all alter historical relationships. The Federal Reserve has also explicitly classified this article as preliminary research by its staff, and the views expressed do not represent the official position of the Board of Governors.
Even so, this work has still opened a window. Traditional macroeconomic data tells us what the total consumption amount is, while county-level card transaction data shows more quickly which groups have started to slow down their spending first. In future discussions about interest rate policies, the statement "consumption still has resilience" needs to be followed by an additional question: from which regions and which income groups does this resilience come, and who has already borne the cost of the tightening measures in their bills?
When 350 million cards are aggregated into one curve, consumption is no longer just a national statistic. Policies may appear to move by 25 basis points in statements, but in real life, this is reflected in people postponing trips, reducing shopping, or continuing to borrow money. High-frequency data makes this transmission process more nearly real-time visible for the first time, and it also makes the differences beneath the average more difficult to ignore.