











As of November 5, XRP is trading at approximately $1.32, still about 42% away from $1.87. The $1.72 average cost basis of XRP ETFs is currently weighing down about $440 million in unrealized losses. This article uses three lines—ETF fund flows, on-chain holder structure, and macro liquidity—to break down the realistic conditions for Ripple's XRP to reach $1.87.
Table: Overview of Latest XRP Data
| Data Dimension | Specific Value |
|---|---|
| Current Price | Approx. $1.32 |
| Market Cap | Approx. $83.89 Billion |
| 24-Hour Trading Volume | Approx. $2.51 Billion |
| Circulating Supply | Approx. 63.35 Billion XRP |
| US Spot XRP ETF Cumulative Net Inflows | Approx. $1.81 Billion |
| XRP ETF Estimated Unrealized Loss | Approx. $440 Million |
| XRP ETF Net Inflows in the Latest Week | Approx. $4.32 Million |
| Wallets Holding at Least 1 Million XRP | 2,147, the highest in 2026 |
| Derivatives Open Interest and Funding Rate | Approx. $2.02 Billion, funding rate at 0.0036% |
Note: The above content is compiled and summarized by CoinMeta based on public market data. Please refer to actual data if there are any fluctuations.
What Does $1.87 for XRP Represent?
Can XRP hit $1.87 in November? And what does $1.87 actually represent? In fact, the market is accustomed to discussing $1.87 as a technical resistance level.
For example, in early 2026, XRP consolidated in the $1.57-$1.87 range, and $1.87 "loosened" after repeated testing. But by November, in our view, the meaning of this price has fundamentally changed.
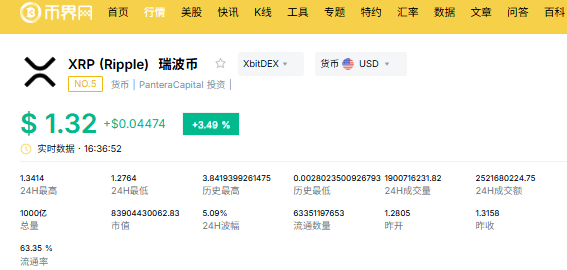
Image: XRP Latest Price
US spot XRP ETFs have seen cumulative net inflows of about $1.81 billion since launch, but the estimated average purchase cost of the five tracked funds is around $1.72, while XRP closed on November 3 at only about $1.28. This means ETF holders are overall in a state of about 25% unrealized loss, estimated at roughly $440 million.
The $1.72-$1.87 range perfectly covers the ETF average cost line and a narrow buffer zone above it. As the price approaches $1.87, those who bought ETFs at high prices will want to sell to break even. In our view, this is not the same as technical resistance on a chart; it is real, tangible selling pressure from investors trying to recover their principal.
Three Conditions for Breaking $1.87 in November
With less than four weeks left in November, for XRP to reach $1.87 from the current ~$1.32, it needs a gain of about 42%. This goal is not entirely impossible, but it requires ETF flows, macro liquidity, and on-chain holder structure to all turn simultaneously. As of November 5, at least two of these three lines are still running in the opposite direction.
ETF Line: Marginal Momentum Is Decaying
In October, XRP ETF net inflows were only $18.83 million, a sharp drop of about 85% from September's $121.4 million. Although last week recorded about $4.26 million in net inflows, reversing the previous week's outflow, against the backdrop of $1.8 billion in cumulative scale, this level of weekly inflow provides extremely limited marginal push for the price. Additionally, the Coinbase Premium Index fell to -0.16% on November 2, an eight-month low, indicating a systemic withdrawal of US buying power.
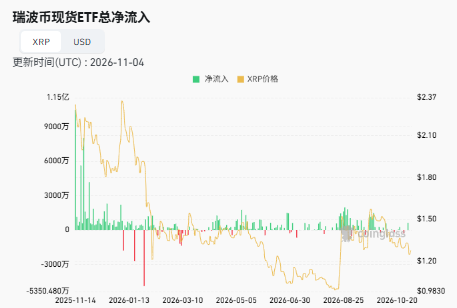
Image: XRP ETF Overview
On-Chain Line: Surface Growth, Underlying Contraction
On November 1, XRPL added 7,934 new wallets, the sixth-highest single day in 2026. But the context for this data is: Q2 active accounts fell about 41% year-over-year, average daily order book trading accounts dropped from over 1,860 to about 1,100, and average daily trading volume per account rose from about 1,070 XRP to about 3,200 XRP.
We can analyze that this means a contraction in retail breadth, and retail breadth is precisely the crucial fuel for XRP's historical rapid rally phases.
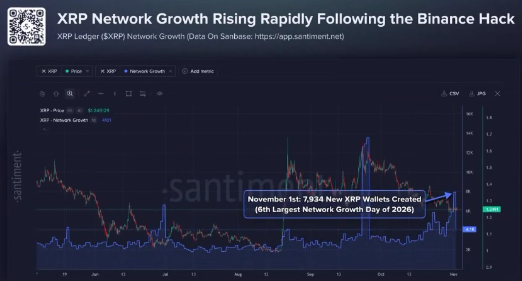
Image: XRPL Added 7,934 New Wallets on November
Looking at whales: the number of wallets holding 10 million to 100 million XRP fell from 351 to 339 in a month, while exchange XRP balances actually increased by about 47 million; however, Binance's whale XRP holdings rose from 399 million to 696 million between October 28 and November 4. During the same period, a large amount of XRP also flowed out of Binance. The direction of chips remains inconsistent.
Macro Line: Lacking Systemic Thrust
By November 2026, the Fed has not yet eased, interest rates remain elevated, and newly printed dollars prefer to sit in Treasuries and money market funds earning interest. Without central bank liquidity injection, crypto assets lack the conditions for sustained upward movement. In our view, for XRP to rise 42% in a month, historically, we have almost never seen it decouple from BTC and overall risk appetite and strengthen independently.
What Is the Probability of XRP Hitting $1.87 in November?
Combining the CoinMeta XRP/USDT daily chart, we believe the probability of a short-term surge to $1.87 is relatively low, at less than 15%. The analysis is as follows:
Candlesticks and Volume Extremely Contracted: The current price is $1.32, situated in a descending channel formed after a previous peak and pullback. Recent candlestick bodies are extremely small, and without volume confirmation, it simply cannot support a unilateral surge of over 40%.
MACD Weak Oscillation Below Zero Axis: Both MACD lines (DIF, DEA) are below the zero axis, and the two lines are almost glued together with a green histogram appearing, indicating the market lacks bullish breakout momentum.
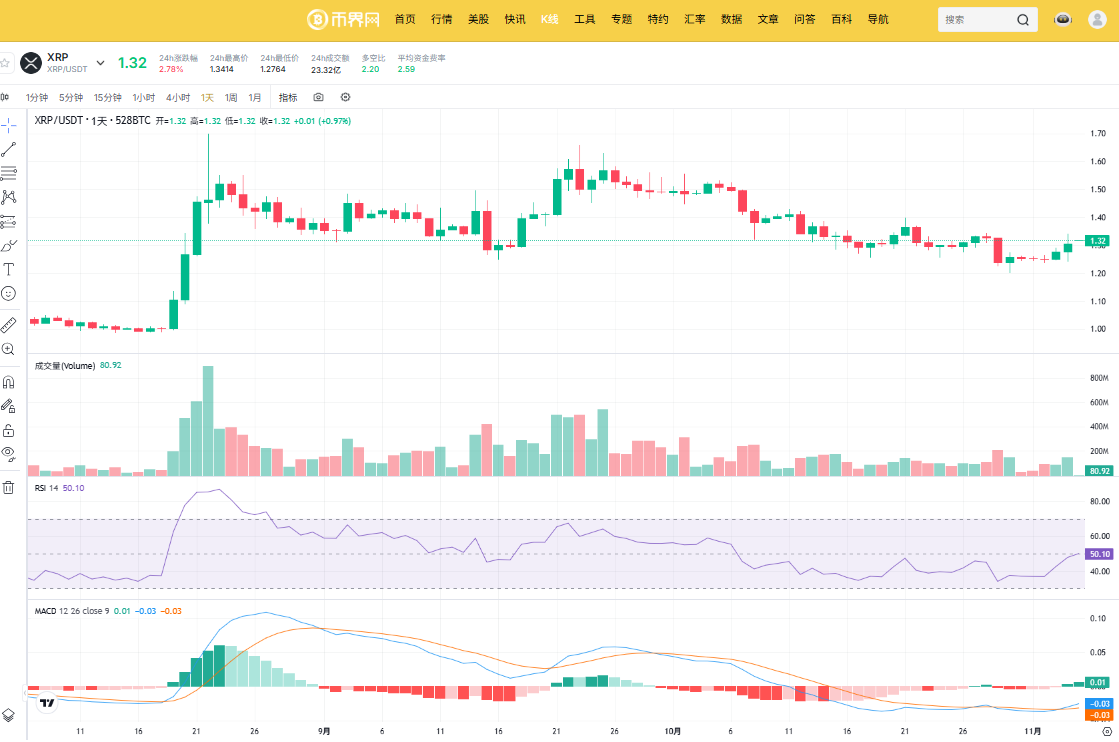
Image: XRP Daily Chart Analysis
RSI in Neutral Zone: 50.10, right near the 50 watershed. We can analyze that bullish and bearish forces are balanced, with neither strong rebound demand from oversold conditions nor overbought risks, representing a typical sideways consolidation period.
So, what is the probability of XRP hitting $1.87 in November? From the chart, the $1.45-$1.50 range is a previous dense trading area. With current average daily volume, XRP would struggle even to break $1.45, let alone directly touch the $1.87 cost ceiling. A more realistic trend is continued oscillating bottoming around $1.30.
Additionally, from a time window perspective, with less than four weeks left in November, combined with the probability of the three lines analyzed above occurring simultaneously, it is very difficult to achieve.
Bullish Analysis for XRP in November
Although the probability of XRP hitting $1.87 in November is very low, it does not equal "zero." We note an undervalued variable:
XRP was granted "digital commodity" status under the joint interpretation of the SEC and CFTC in March 2026, and the CLARITY Act being stalled in the Senate has not changed this legal status. If any unexpected progress pointing to an accelerated federal regulatory framework emerges within November, or a major payment institution announces an upgrade of its ODL channel from a pilot to scaled settlement, $1.87 could be breached under macro tailwinds.
Conclusion
XRP hitting $1.87 in November is a "low probability, non-zero" scenario. We recommend first watching whether $1.45-$1.50 can be reclaimed and held; that would be the true signal of on-chain contraction reversing and institutional expansion. Until the ETF average cost basis is pulled down closer to the current price, $1.87 requires patience, not courage.
FAQ
Q1: Can XRP reach $1.87 in November?
The probability is low, but not zero. It requires a roughly 42% gain in less than four weeks, while simultaneously meeting three conditions: ETF weekly inflows rebounding to tens of millions of dollars, macro risk appetite turning, and the price first holding $1.45-$1.50. Currently, only the first condition shows weak positive signs.
Q2: Is $1.87 a technical resistance?
Not entirely. It is more like an ETF cost line. The estimated average purchase price of the five spot XRP ETFs is about $1.72, and $1.87 covers a narrow buffer zone above the cost line. When the price approaches this area, the motivation to break even forms real supply, different in nature from traditional technical resistance.
Q3: How much are XRP ETF holders currently losing?
About $440 million in unrealized losses. XRP ETFs have cumulative net inflows of about $1.81 billion, but the average purchase cost is about $1.72, while the closing price on November 3 was only about $1.28, resulting in an overall unrealized loss of about 25%.
Disclaimer: Readers are strictly advised to comply with local laws and regulations. This article is compiled based on public market data for reference and educational purposes only, and does not constitute investment advice.