













Bitcoin once again reached $76,000 on November 7th, but the intraday momentum was weak. Coupled with a net outflow of $411.9 million in US spot Bitcoin ETF, its rebound came close to a key weekly support level.
The Bitcoin trading price is close to $76,070, and the daily RSI indicator is below the neutral level at 38.78.
The 50-week moving average is at around $75,562, slightly above the weekly pivot point of $75,000.
The liquidation ranges are distributed above and below the market, with the concentrated area closer to the top being around $76,500 to $77,500.
In the trading week from November 2nd to 6th, approximately $1.28 billion of spot Bitcoin ETF from the United States flowed out.
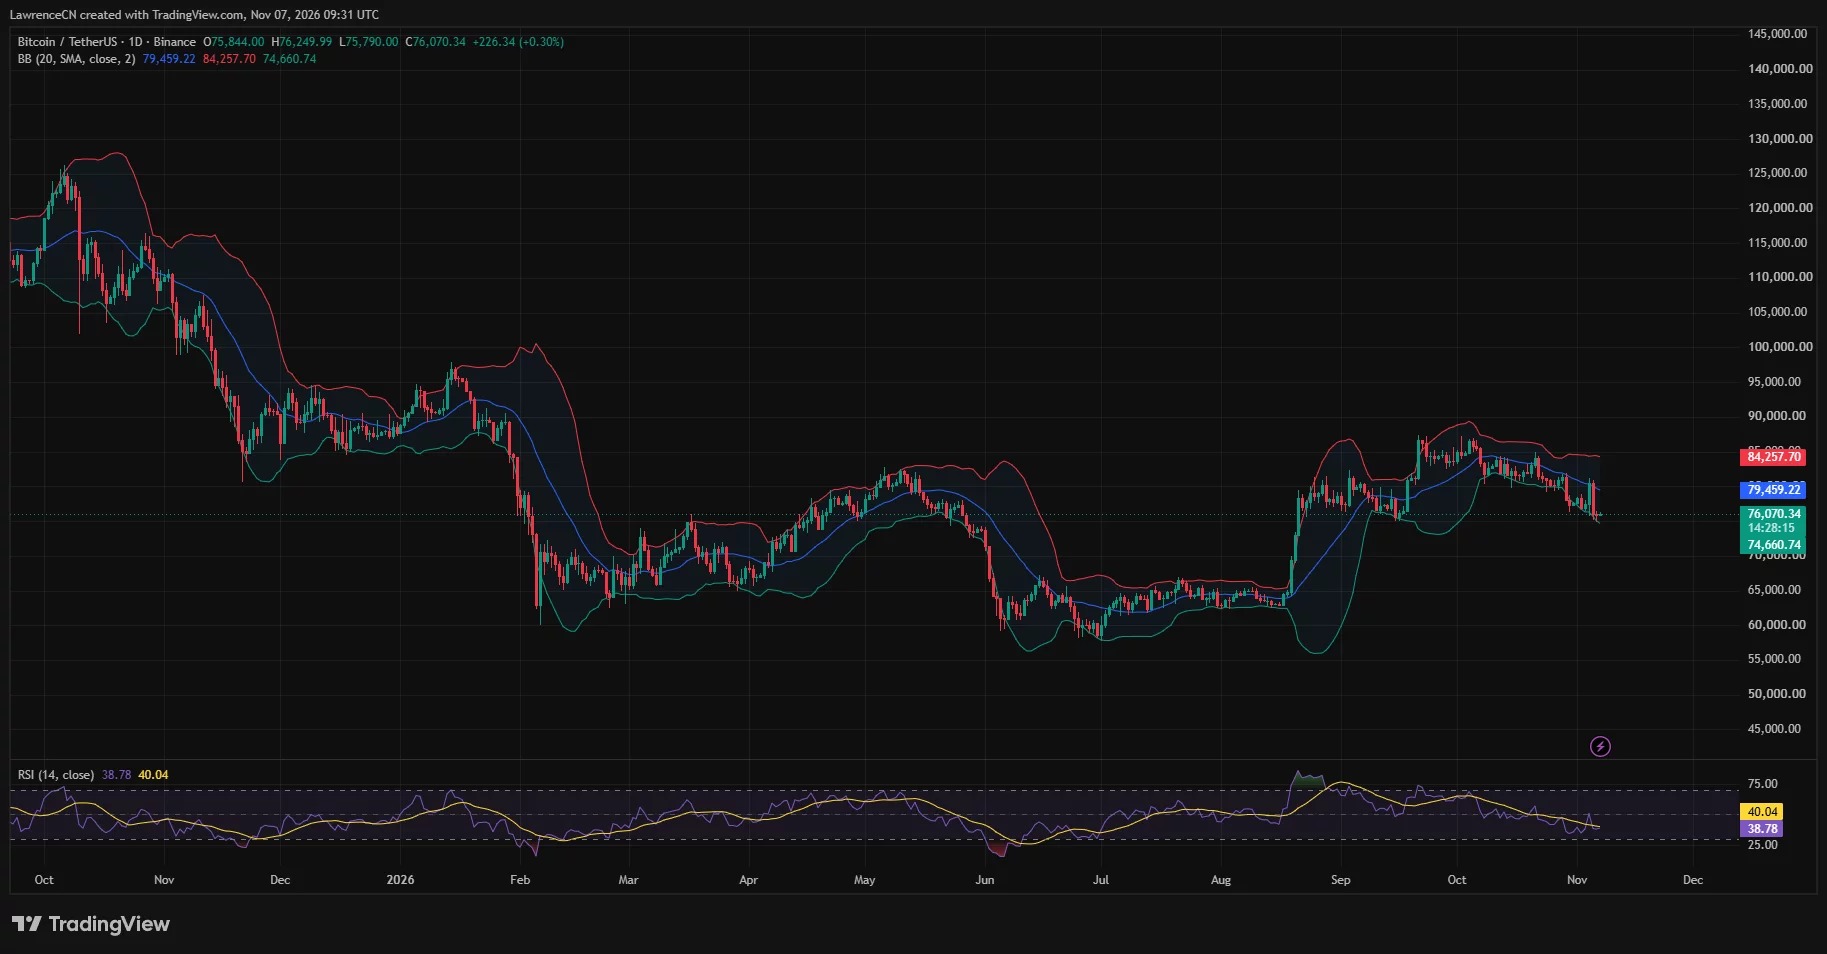
According to the daily chart, Bitcoin was at $76,070 at UTC at 09:31, with a 0.30% increase on Saturday. After failing to regain the $80,000 level this week, the price fluctuated between $75,790 and $76,250, with a relatively narrow range.
Earlier this week, when Bitcoin broke through this level, it was accompanied by a hourly short liquidation of $378.09 million, as previously reported by crypto.news. By Saturday, this cryptocurrency was about 5.5% lower than the price of $80,470 recorded during that previous round of gains.
Bitcoin holds its support on the weekly chart, but the daily momentum remains weak.
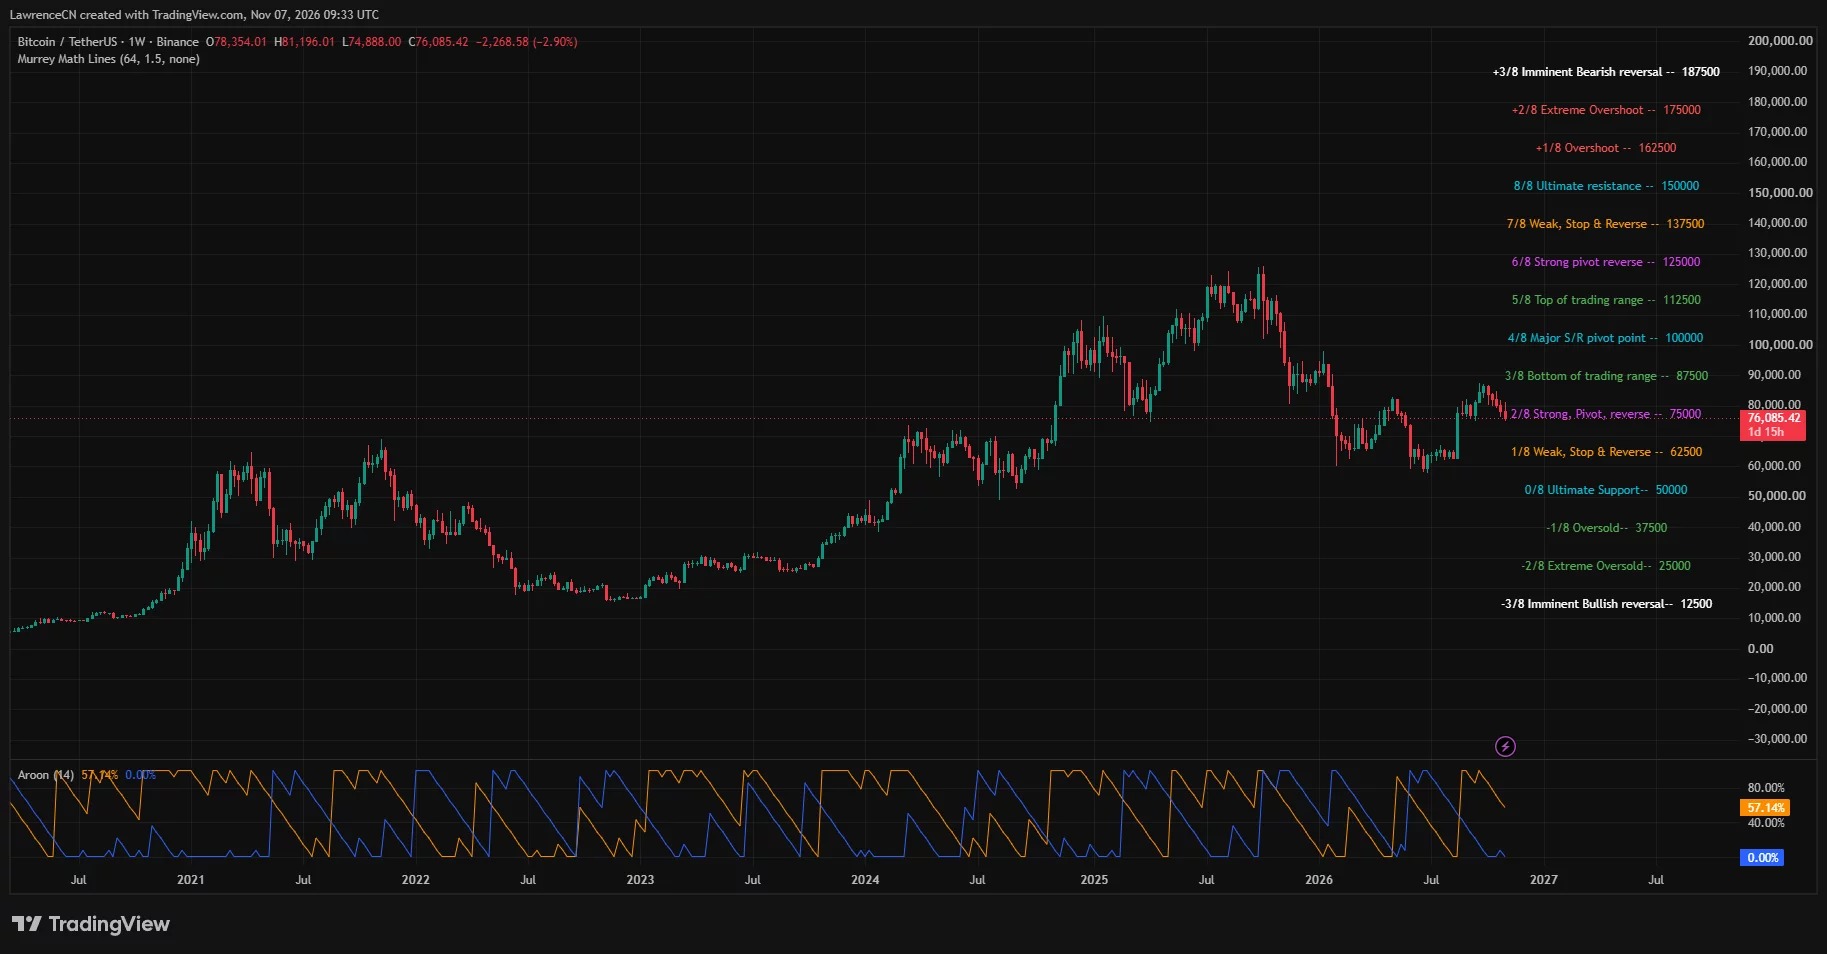
The weekly chart shows that Bitcoin is trading at $76,085, which is a 2.90% decline from the opening price of $78,354 at the beginning of the week. The highest price was $81,196, and the lowest was $74,888, indicating that the market experienced significant fluctuations before falling back to around $76,000.
Although Bitcoin briefly fell below the $75,000 Murrey Math pivot point, it was still above that level in the snapshot on Saturday. Since the weekly candlestick chart has not yet closed, it is still uncertain whether this position will be held onto in the end.
On November 7th, market commentator Max Crypto pointed out in a post that the 50-week moving average is a key level that requires attention. His chart showed that this moving average was at $75,561.73, with Bitcoin being less than 1% away from this level.
He wrote, "Hold on to it, and the bulls will take control." He also warned that if this moving average is lost, it could lead to further weakness.
The daily indicators do not bring much encouragement. Bitcoin is still below the middle band of the Bollinger Bands, which is at 79,459.22 USD on a 20-day simple moving average. The lower band is at 74,660.74 USD, placing another technical reference point just below the weekly pivot level.
RSI is at 38.78, which is still below the neutral level of 50 and also below its own average of 40.04. The momentum is weak, but the reading is still above 30, which is generally considered a oversold threshold.
The price has improved from the Friday reading of $75,799, when Bitcoin was also holding that same support level. However, during this period, the middle band of the Bollinger Bands has moved down from around $79,759, indicating that this modest rebound has not reversed the downward trend of the daily average.
The upper band of the daily Bollinger Bands is at $84,257.70, which is higher than the $80,000 rebound level that was not sustained, as well as higher than the recent consolidation zone. In the weekly Murrey Math grid, the next marked level below $75,000 is $62,500.
There are liquidation zones around $76,000.
The three-day settlement heat map for CoinGlass shows that the concentrated area near the top is between $76,500 and $77,500. Before Bitcoin touches the daily moving average, it will first encounter this range, which is about 4.5% higher than the price on Saturday's chart.
Below the market, the visible concentrated areas are clustered around $75,000 and approximately $74,400 to $74,600. The latter is close to the lower band of the daily chart, compressing several reference levels on multiple charts within a relatively narrow price range.
Market commentator Crypto Lens presented a more bearish scenario in another post dated November 7th, predicting that prices would fall from $76,000 to $70,000 and then to $65,000 before rebounding. In his chart, he marked $65,000 as a potential ultimate bear trap, with a final target of $110,000.
The forecast of $65,000 is about 14.6% lower than the reading of $76,070 on Saturday. This is still just a forecast with attribution, and the most recent downward level visible on the current heat map is much closer to the market.
Bitcoin ETF saw a net outflow of $1.2817 billion this week.
Data from Farside Investors indicates that on November 6th, there was a net outflow of $411.9 million in spot Bitcoin ETF from the United States. BlackRock's IBIT saw an outflow of $403 million, while Fidelity's FBTC attracted $42.8 million in capital inflows.
On Friday, there was an outflow following a net outflow of $430.2 million on Thursday, resulting in a total outflow of $842.1 million over the two trading days. The reversal on Thursday wiped out the previous day's net inflow of $74.6 million.
During the entire five trading days from November 2nd to November 6th, these funds experienced a total net outflow of $1.2817 billion, with only Wednesday seeing a net inflow.
On Friday, BITB had a outflow of $20.5 million, Ark had an outflow of $20.1 million, and Grayscale had an outflow of $11.1 million. The remaining products listed in the Farside table had a net outflow of zero for that day.
Disclosure: This article does not constitute investment advice. The content and materials on this page are for educational purposes only.