











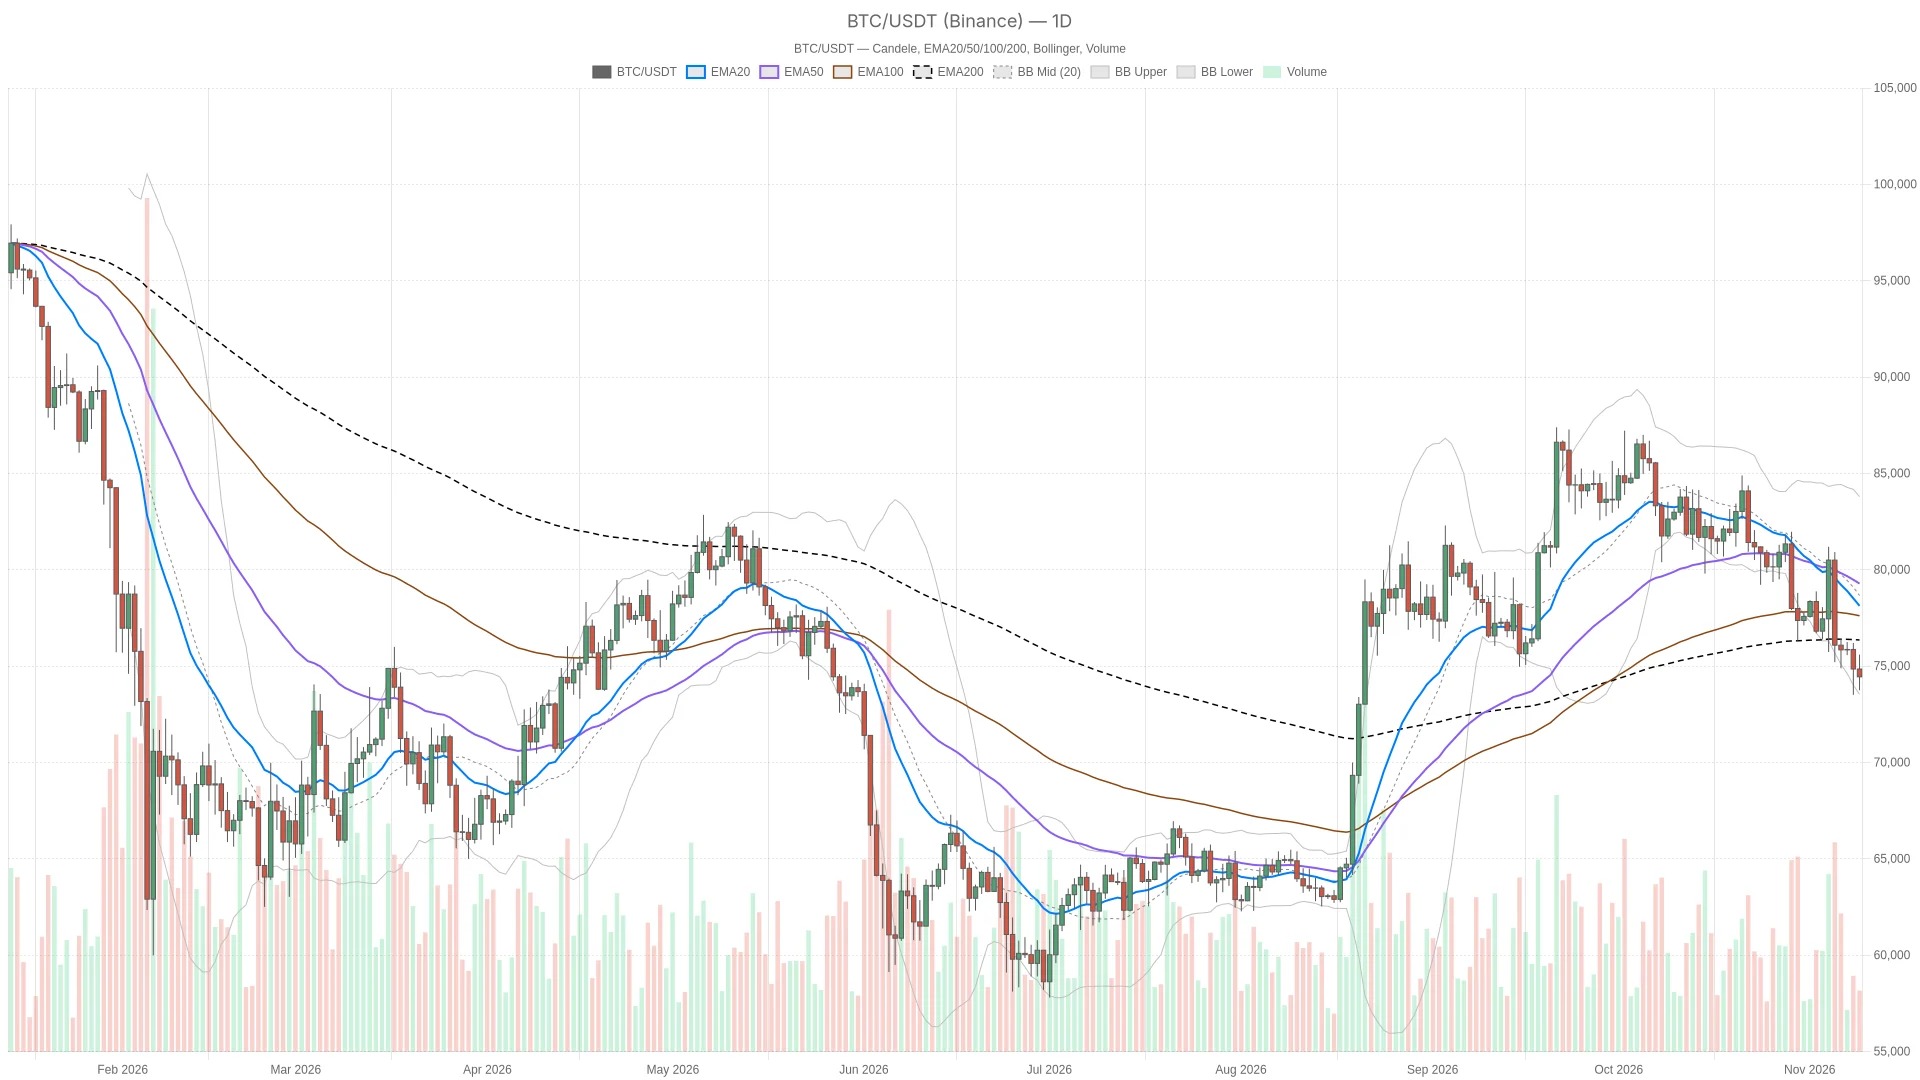
On November 9, 2026, Bitcoin traded at $74,445.35 on Binance and attempted a short-term rebound against a generally bearish daily trend. However, the more immediate question is whether this rebound will be able to regain the $74,853.81 daily pivot level, rather than merely temporarily interrupting the downward pressure.
Key Points
- Bitcoin is trading at $74,445.35, below the daily pivot point of $74,853.81 and also below the three-day moving averages.
- Recent declines and rebounds have been accompanied by a $1 billion liquidation.
- The Fear and Greed Index is at 29, indicating that the market is in a state of fear.
- On the daily chart RSI, it fell to 35.6, and the negative bar represented by MACD continued to widen.
- To confirm a bullish recovery, it is necessary for the daily close to be above $74,853.81.
The reason for distinguishing this is that the signals given by different time frames are not consistent. The hourly level structure is still relatively weak, but the momentum on the 15-minute chart has turned positive. This indicates that what is currently happening is more like a rebound towards the mean, and it has not yet constituted a confirmed trend reversal.
Liquidation and market fear set the backdrop for a rebound
The decline and rebound of Bitcoin triggered $1 billion in liquidations, highlighting the intensity of this round of volatility. Therefore, it is particularly important to distinguish between short-term repairs during trading hours and more lasting structural improvements.
CoinGecko data shows that the total market value of the crypto market is 2.47 trillion US dollars, with a 6.08% decline over 24 hours. Bitcoin holds a market share of 60.20%. The overall contraction supports a more defensive market interpretation; however, looking solely at the market share data does not indicate the direction of capital flows.
The price of Bitcoin is still below the resistance levels of the daily and hourly trend lines.
Bitcoin is currently below all three of its daily moving averages, as well as all three of its hourly moving averages, indicating that the price is still under pressure on both time frames. According to the daily data from Binance, it is below $78,516.35 (marked as EMA20), $79,482.06 (marked as EMA50), and $76,377.72 (marked as EMA200). These moving averages are not arranged in a traditional bearish sequence, so the bearish outlook is more based on the weakness in prices rather than a completely orderly downward trend on the daily chart.
The signals on the hourly chart are even clearer: the price is below $75,044.04 (which is EMA20), $75,552.15 (which is EMA50), and $76,986.67 (which is EMA200), and these moving averages are arranged in a bearish pattern. Furthermore, this also confirms that the rebound has not yet repaired the medium-term structure; the hourly EMA20 is the nearest moving average resistance level.
From a purely execution-oriented perspective, the 15-minute chart shows that the price is near its EMA20, but it is still below EMA50 and EMA200. These moving averages also maintain a bearish alignment. Smaller time-frame charts show only temporary stabilization and do not reverse the bearish trend of the higher time frames.
Hourly oversold momentum conflicts with the strengthening trend at the 15-minute level.
There is a clear divergence in momentum readings across different time frames: the hourly chart shows oversold conditions, while the 15-minute chart has turned positive. On the daily chart, RSI has fallen to 35.6, and the negative bar on the daily chart MACD continues to widen. Neither of these two indicators supports a reversal in daily momentum: RSI is weak but not yet oversold, whereas the bar chart for MACD indicates that downward momentum is strengthening.
The hour RSI has dropped to 28.2, which is considered an oversold reading, and at the same time, the negative bar for MACD is also expanding. This tension is significant: an oversold market may see a sharp rebound, but the completed hourly readings still indicate deterioration rather than improvement.
The 15-minute chart provides contrary evidence. RSI has risen to 46.2, and the bar chart for MACD has entered the positive range. This supports the current rebound, however, RSI is still below the central axis. There is indeed an improvement at the execution level, but this does not constitute confirmation from the daily or hourly charts.
The lower Bollinger Band on the daily chart is at $74,015.94, the middle band is at $79,094.74, and the upper band is at $84,173.53. The price is close to the lower band of the daily chart and far below the middle band, which further reinforces the judgment that the market is still under pressure and not trading within a central range.
Daily pivot point distinction repair attempt followed by another downward trend
The daily pivot point of $74,853.81 serves as the boundary that distinguishes between a repair attempt and a further decline, and Bitcoin is currently still below this level. Below the current price, the lower band of the daily Bollinger Bands at $74,015.94 constitutes the first daily support level, followed by the $73,507.63 mark associated with the daily S1. These are the direct boundaries that will test whether this round of rebound has any substance.
On the hourly chart, the price has already surpassed the level of $74,249.34, which corresponds to R1. Therefore, this level is now below the current price and can be considered as potential support, rather than a trigger point waiting to be broken through. Meanwhile, the hourly pivot point is at $74,010.69, followed by the lower band of the hourly Bollinger Bands at $73,833.04, and then the level of $73,631.36, which corresponds to S1. To confirm a real-time recovery to the level of R1, it is still necessary for a completed candlestick to confirm this move: the previous completed hourly candlestick must close at $73,870.02.
Bullish scenario: If the daily close is above the daily pivot point of 74,853.81 USD, it will constitute a repair trigger signal. Subsequently, it may test 76,197.63 USD, which is the level of the daily R1, and above that is 76,377.72 USD, which is the level of the daily EMA200. If the daily close falls below the lower band of the daily Bollinger Bands at 74,015.94 USD afterward, then this bullish scenario will be invalidated.
Bearish scenario: If the daily close falls below the lower band of the 74,015.94 USD daily Bollinger Bands, it will confirm a new round of breakdown. At that time, market attention will shift to the 73,507.63 USD level of the daily S1. If the daily close subsequently rises back above the 74,853.81 USD daily pivot point, then this bearish scenario will be invalidated.
The daily ATR level is at $2,293.88, the hourly ATR level is at $486.99, and the 15-minute ATR level is at $291.58. The above readings indicate that a brief crossing of nearby key levels does not carry as much conviction as a completed close. The most likely false signal would be a short-term bullish breakout that fails to sustain and remain above the daily pivot point; merely positive momentum at the 15-minute level is not sufficient to overcome bearish evidence from higher time frames.
Frequently Asked Questions
Is Bitcoin always oversold across all time frames?
No. The hour RSI is at 28.2, which indicates an oversold condition, but this is not the case for the daily chart and the 15-minute time frame. The judgment of oversold only applies to the hourly chart, not to the entire trading structure.
Is the daily moving average in a bearish arrangement?
No. Although the price is below the three-day moving averages, the arrangement of these moving averages is mixed and not a standard bearish pattern. A clearer bearish pattern is observed in the hourly moving averages.
This article was generated with the assistance of artificial intelligence and has been reviewed by an editorial team.
Lorenzo Marcek
Lorenzo Marcek is a financial journalist and senior crypto market analyst, known for his clear and data-driven reporting on digital assets. With a background in economics and over a decade of experience covering global markets, he specializes in on-chain indicators, institutional adoption trends, and macroeconomic factors that influence crypto market volatility. His work combines investigative journalism with insights into the technology market, making him a trusted source for traders seeking solid and actionable analysis.