As of October 5, 2026, the price of Cardano on Binance was reported at $0.2724, slightly higher than its daily R1 pivot point. ADA is approaching the upper band of the recent daily Bollinger Bands, with the hourly RSI at a high level in the 70s. Fear and Greed Index are both at 70, indicating a "greedy" range.
Key Points
- ADA reports $0.2724, higher than the daily R1 price of $0.2714.
- The hourly RSI14 is at 79.78, indicating overbought conditions; the daily RSI14 is at 65.26, still showing a positive trend.
- If the closing price for the hour is above $0.274, it could pave the way for a move towards $0.27648.
- When Fear and Greed Index are 70, it displays "greedy"; the total market value of the crypto market is approximately 2.92 trillion US dollars.
- Petrobras Petrobras is testing Cardano for tracking renewable aviation fuel and diesel.
The current main force is kinetic energy, which drives prices to move upward in a textbook-style bullish pattern on the hourly and 15-minute charts EMA. However, this kinetic energy also shows typical overbought readings, which usually indicates that the market is more likely to pause before continuing to rise directly.
The daily chart is still catching up: its EMA alignment is not entirely neat, and although the MACD bar chart is moving closer to the zero axis, it is still negative. In short, the short-term trend is dominating the movement, while the larger-scale daily structure is still lagging behind. The two time frames are not yet completely in sync.
Cardano Price Tug-of-War: Daily Line Consolidation and Hourly Overheating

On the daily chart, the market condition is neutral. RSI14 reports 65.26, which is a continuous increase from the previous three trading days' levels of 58, 57.6, and 65.3. It is moving upwards, but has not yet entered an overbought zone. The MACD bar chart shows -0.000247, which is still negative, but there has been a recovery from the previous readings of -0.000401 and -0.0009. This indicates that the bearish pressure below is weakening, although it has not yet turned positive. At the daily level, we see a market condition that is gradually strengthening, but has not yet been confirmed.
The hourly chart tells a more dramatic story. Its status is marked as bullish. The value of RSI14 is 79.78, which continues to rise from the previous levels of 75.6, 78.6, and 79.8. This is a true overbought reading, not just close to overbought.
At the same time, although the bar chart for hour MACD still shows a positive value of 0.00158, it is continuously declining from 0.00177, 0.00167, and 0.00158, with the range narrowing. This indicates that even though the price is still slowly rising, the momentum is slightly weakening. This is precisely the kind of divergence that makes it less likely for there to be continued one-way surges in the short term.
The 15-minute chart falls somewhere in between. The RSI14 value is 64.22, which is an increase from 63, 61.4, and 64.2, but it has not been overextended. Its MACD bar chart shows a value of -0.0000294, which is still negative, but it is on the rise and narrowing in range—in fact, it is hovering right on the boundary between negative and positive values. The tension here is quite clear: the daily chart is still establishing a strong foundation, the hourly chart has issued an overbought warning, while the 15-minute chart is on the sidelines, waiting to see what happens next. Therefore, the signals at the execution level are mixed, and there is no clear green light for going long.
The structure of hourly and 15-minute charts is still prevalent, but the arrangement of the daily moving averages is not ideal.
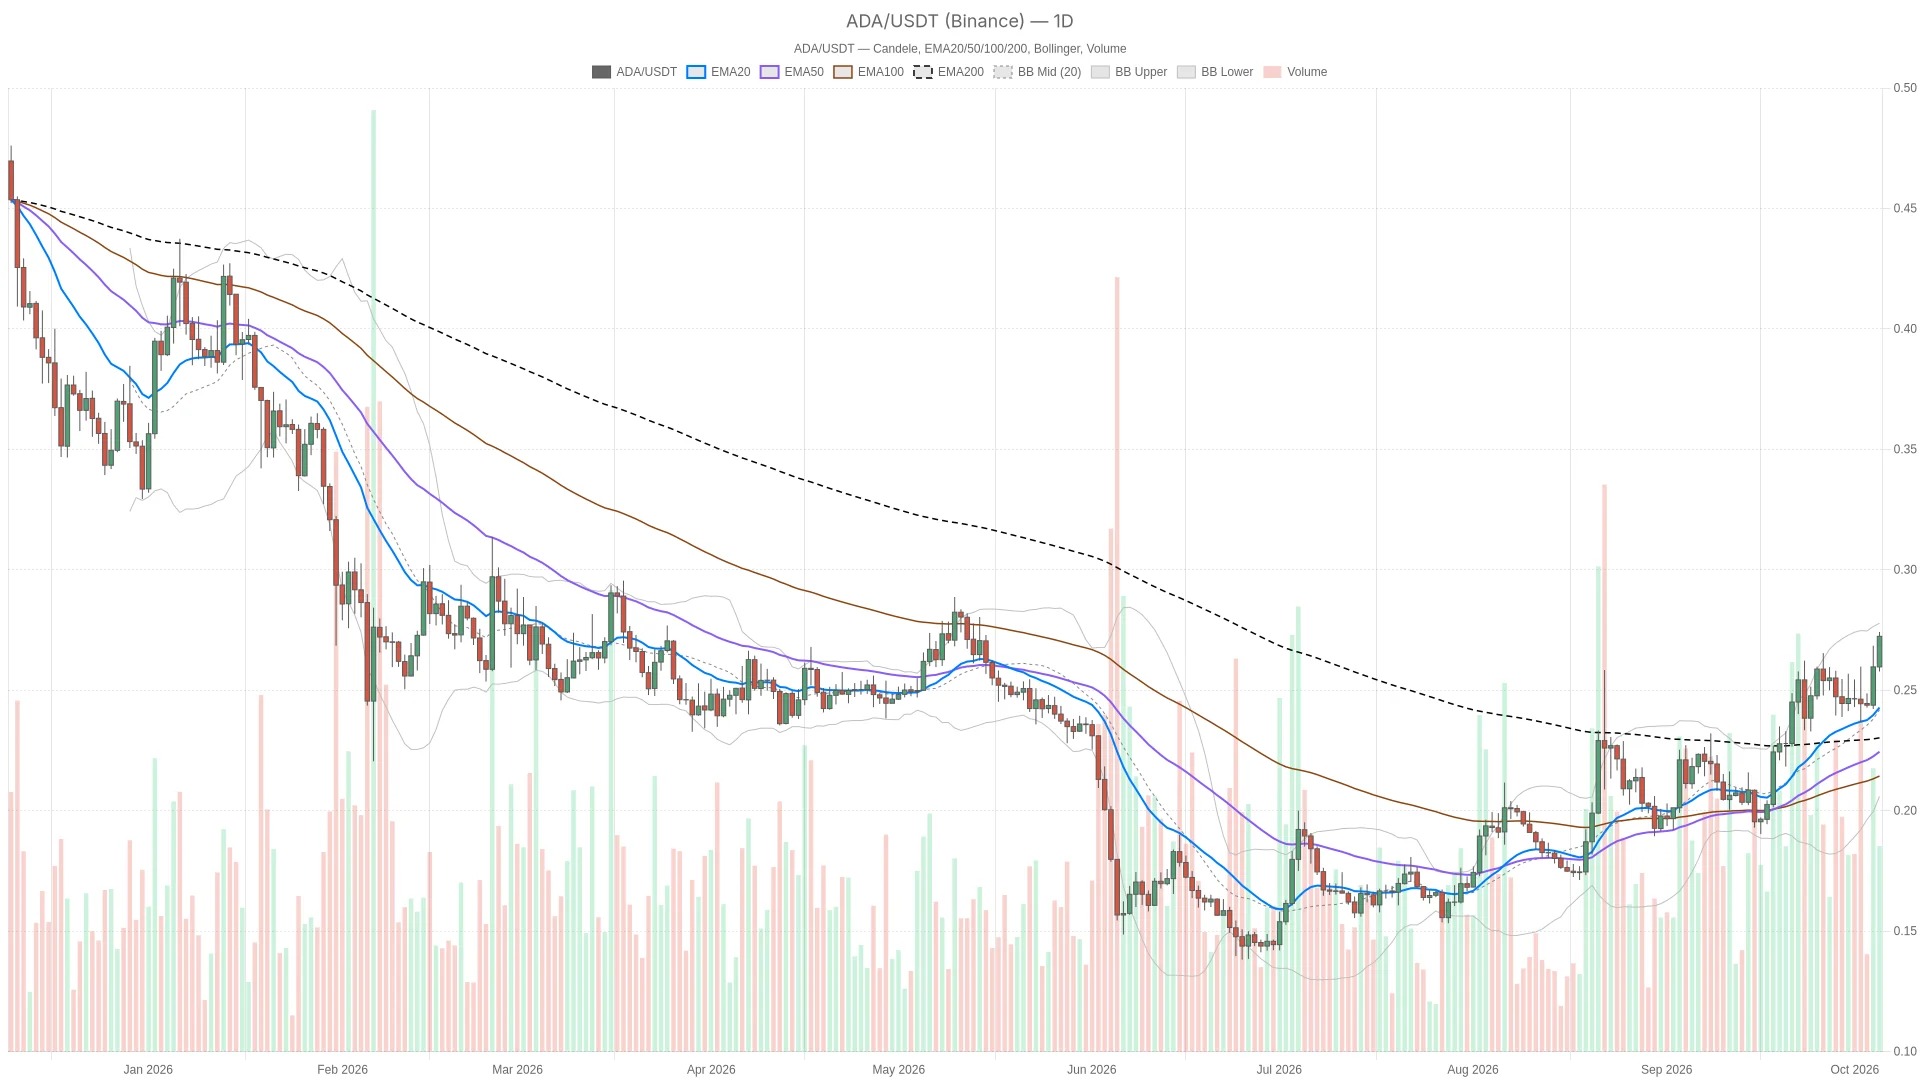
In the daily time frame, the price of $0.2724 is higher than three moving averages: the 20-day EMA at $0.2397, the 50-day EMA at $0.2225, and the 200-day EMA at $0.2298. However, the order of the 50-day EMA is mixed, as it is lower than the 200-day EMA. This does not constitute a textbook example of a bullish pattern. The rate at which the price has risen and moved above the moving averages is faster than the speed at which the moving averages themselves have reorganized.
The middle band of the daily Bollinger Bands is at $0.2380, the upper band at $0.27648, and the lower band at $0.19959. The current price is near the upper band. This usually indicates that for the price to continue to rise, the Bollinger Bands themselves need to widen, rather than just staying within the bands. The daily ATR14 is at $0.01586, and the range of fluctuation is wide enough, which means that the current daily fluctuation of about $0.01586 should not be considered abnormal.
The hourly chart is more orderly: the price is above three EMA; the 20-hour EMA is at $0.25903, the 50-hour EMA is at $0.25265, and the 200-hour EMA is at $0.24952 – and they are indeed arranged quite closely and aligned. The middle band of the Bollinger Bands is at $0.25623, with the upper band at $0.27502; the price has been hovering near the upper edge. The hourly ATR14 is at $0.00441, which is still relatively tight compared to the already achieved increase.
The structure of the 15-minute chart is similar to that of the hourly chart. The EMA levels are located at $0.2689, $0.26363, and $0.25346 respectively, all of which are below the current price, and they are in a bullish order. The upper band of the Bollinger Bands is at $0.27337, while the price of $0.2725 is slightly below this level. Compared to the hourly chart, there is a slightly larger margin of space here.
Overall, there are more short-term cycles in both cases. However, both are operating near the upper edge of their respective ranges of fluctuations. Without any prior consolidation, it is not solid enough for the prices to continue rising from this point.
The hour RSI approaches 79.8, indicating overheated momentum; the MACD bar chart, however, shows mixed signals.
First, let's look at each time frame: on the daily chart, it's at 65.26 and continues to rise, which is positive but not excessively expanded; on the hourly chart, it's at 79.78, clearly in an overbought zone—there's hardly any room for further buying. Unless there's a further acceleration, it will be difficult for the value to continue to rise. On the 15-minute chart, it's at 64.22, also on the rise, but in a more comfortable middle range. This distribution is important: it is the hourly chart that shows a true stretch, not the daily or 15-minute charts. The cooling down in this time frame does not necessarily contradict the larger trend.
MACD adds another layer of information. The daily bar chart shows -0.000247, which is still negative, but the closing prices over the past three days have been on the rise and narrowing. This indicates that the downward momentum is weakening, although it has not yet confirmed a break above the zero line. The hourly bar chart still shows a positive value of 0.00158, but it is declining and narrowing as well – the momentum is cooling down from a positive position, indicating fatigue rather than a reversal.
The bar chart for the 15-minute time frame shows a value of -0.0000294, which is still negative but is on the rise and narrowing in range, almost reaching the threshold for turning positive. Overall, both the daily chart and the 15-minute MACD chart are moving closer to the bullish side above the zero axis, while the hourly chart is falling from its peak. There is indeed a divergence in direction among the different time frames, although the magnitude of each divergence is not significant.
The daily line R1 coincides with the hourly pivot at $0.2714: key price levels and two scenarios
The current price of $0.2724 has broken through the daily level of $0.2714 (R1), and this level also happens to be a hourly pivot point. This overlap is worth noting because it serves as both a daily and hourly reference point at the same time. Once the price has surpassed this level, it now acts more as support rather than resistance.
Above the current price, the next daily reference level is the upper Bollinger Band at $0.27648. On the hourly chart, the first resistance level is $0.274, which corresponds to the hourly R1, followed by the upper Bollinger Band at $0.27502. If the price falls below $0.2714, the hourly S1 level of $0.2686 and the daily pivot point of $0.2568 will become the next reference levels below that.
For a bullish scenario, it is necessary for the hourly close to exceed $0.274, which is the hourly R1, in order to create a path towards the upper band of the daily Bollinger Bands at $0.27648. If the hourly close falls back below $0.2714, which coincides with the daily R1/hourly pivot point, then this breakout attempt will be considered unsuccessful. A bearish scenario would unfold if the hourly close falls below $0.2714, which would open the way for a decline to the hourly S1 of $0.2686 and further towards the daily pivot point of $0.2568 as pressure increases. If the hourly close manages to return above $0.2714, then this bearish scenario would become invalid.
Given that the value for hour RSI is approaching 79.8, and while the bar chart for hour MACD remains in positive territory, it continues to weaken, the most likely false signal that could occur here is a rapid price break above hour R1, and even a brief breakthrough above the upper band of the daily Bollinger Bands. However, it will ultimately not be able to hold that level at the close of the hour. This would more closely resemble an upper shadow line driven by short-term overheated momentum, rather than a sustained trend.
Cardano DEX Trading Volume and Petrobras Traceability Pilot
In the past 24 hours, the trading volume of DEX on the Cardano chain was 3,389,631 US dollars. The performance of various trading venues was not consistent; there was neither a general increase nor a general decrease. On Minswap, the daily trading volume decreased by 28.18%, but over the past week, it still increased by 106.45%. On SundaeSwap V2, the price fell by 18.89% during the day, but it rose by 84.88% on a weekly basis.
Dano Finance has seen a significant decline, falling 64.15% within the day and 44.73% over the past 7 days. WingRiders fell 28.93% during the day and 23.36% on a weekly basis. Splash Protocol, however, moved against the trend, rising 60.24% within the day and 97.81% over the past week. This cross-platform divergence does not support the existence of a single narrative for current on-chain activities.
On the surface, Petrobras has been reported to be continuously testing Cardano for tracking renewable aviation fuel and diesel. Reports from Cointelegraph, CoinDesk, and Cryptonomist all point to the same pilot project, which is the traceability of sustainable fuels. Additionally, according to Cryptonomist, Charles Hoskinson plays a role in what this media refers to as the Cardano ecological governance transformation. Both of these stories are set against the backdrop of the current price trend, corresponding to real-world applications and governance narratives respectively, although they do not directly reflect the intraday technical structure.
Market Background: Greed Index at 70, Total Crypto Market Capitalization Remains at Approximately $2.92 Trillion
According to Alternative.me, Fear & Greed Index is 70, which falls within the "greedy" range. CoinGecko shows that the total market value of cryptocurrencies is approximately 2.92 trillion US dollars, with a decrease of 1.63% in the past 24 hours, and Bitcoin accounts for 59.24%. This combination—where the sentiment indicator is biased towards greed, yet the overall market value has declined on that day—creates a slight tension with the overbought condition indicated by ADA at the RSI hour. Although the overall risk appetite remains high, the total market value has slightly decreased.
Frequently Asked Questions
ADA What is the current trading level?
The price of ADA on Binance is $0.2724, which is higher than the daily R1 and the hourly pivot points, both of which are at $0.2714.
ADA Is it currently overbought?
The hourly RSI14 reading is 79.78, which is clearly an overbought level; the daily RSI14 reading is 65.26, and although it is rising, it has not yet entered the overbought range. The 15-minute RSI14 reading is 64.22.
What can confirm that ADA will continue to rise?
If the hourly closing price reaches $0.274, it will create room for a move towards the upper band of the daily Bollinger Bands at $0.27648.
What indicates a bearish reversal?
If the hourly close falls below $0.2714 – which is the overlap of the daily R1 and the hourly pivot point – it will create a path for a decline to the hourly S1 of $0.2686 and the daily pivot point of $0.2568.
This article was generated with the assistance of artificial intelligence and has been reviewed by an editorial team.