Rare "once every four years" signal for Bitcoin appears again: Dynamic rainbow chart and 200-week moving average heat map both point to the buying zone
U.Today
53m ago
Ai Focus
U.Today reports that Lookonchain has observed that the price of Bitcoin has simultaneously fallen into the deeply undervalued area indicated by Dynamic Rainbow Chart and the 200-week moving average heat map. The article states that such a synchronous signal has only appeared during extremely pessimistic periods in previous macroeconomic cycles, such as in 2015, 2018, 2020, and 2022, and usually corresponds to the continuous absorption of long-term funds.
Helpful
No.Help

As public attention shifts from Bitcoin, which has been in a sideways consolidation phase, to assets with higher volatility, Bitcoin's long-term indicators have already completed a transition to a deep cyclical bottom stage.

The analysis platform Lookonchain has discovered a synchronization signal: in past macroeconomic cycles, this signal has opened the door to the largest-scale upward trends. That is, the asset price simultaneously falls into the strongly undervalued areas indicated by Dynamic Rainbow Chart (dynamic rainbow chart) and 200 - week moving average heatmap (200-week moving average heat map, 200WMA Heatmap).

Historically, this moment signifies only one thing: retail speculators have finally lost interest in the long-term sideways trend, and it has been replaced by the steady absorption by large strategic participants.
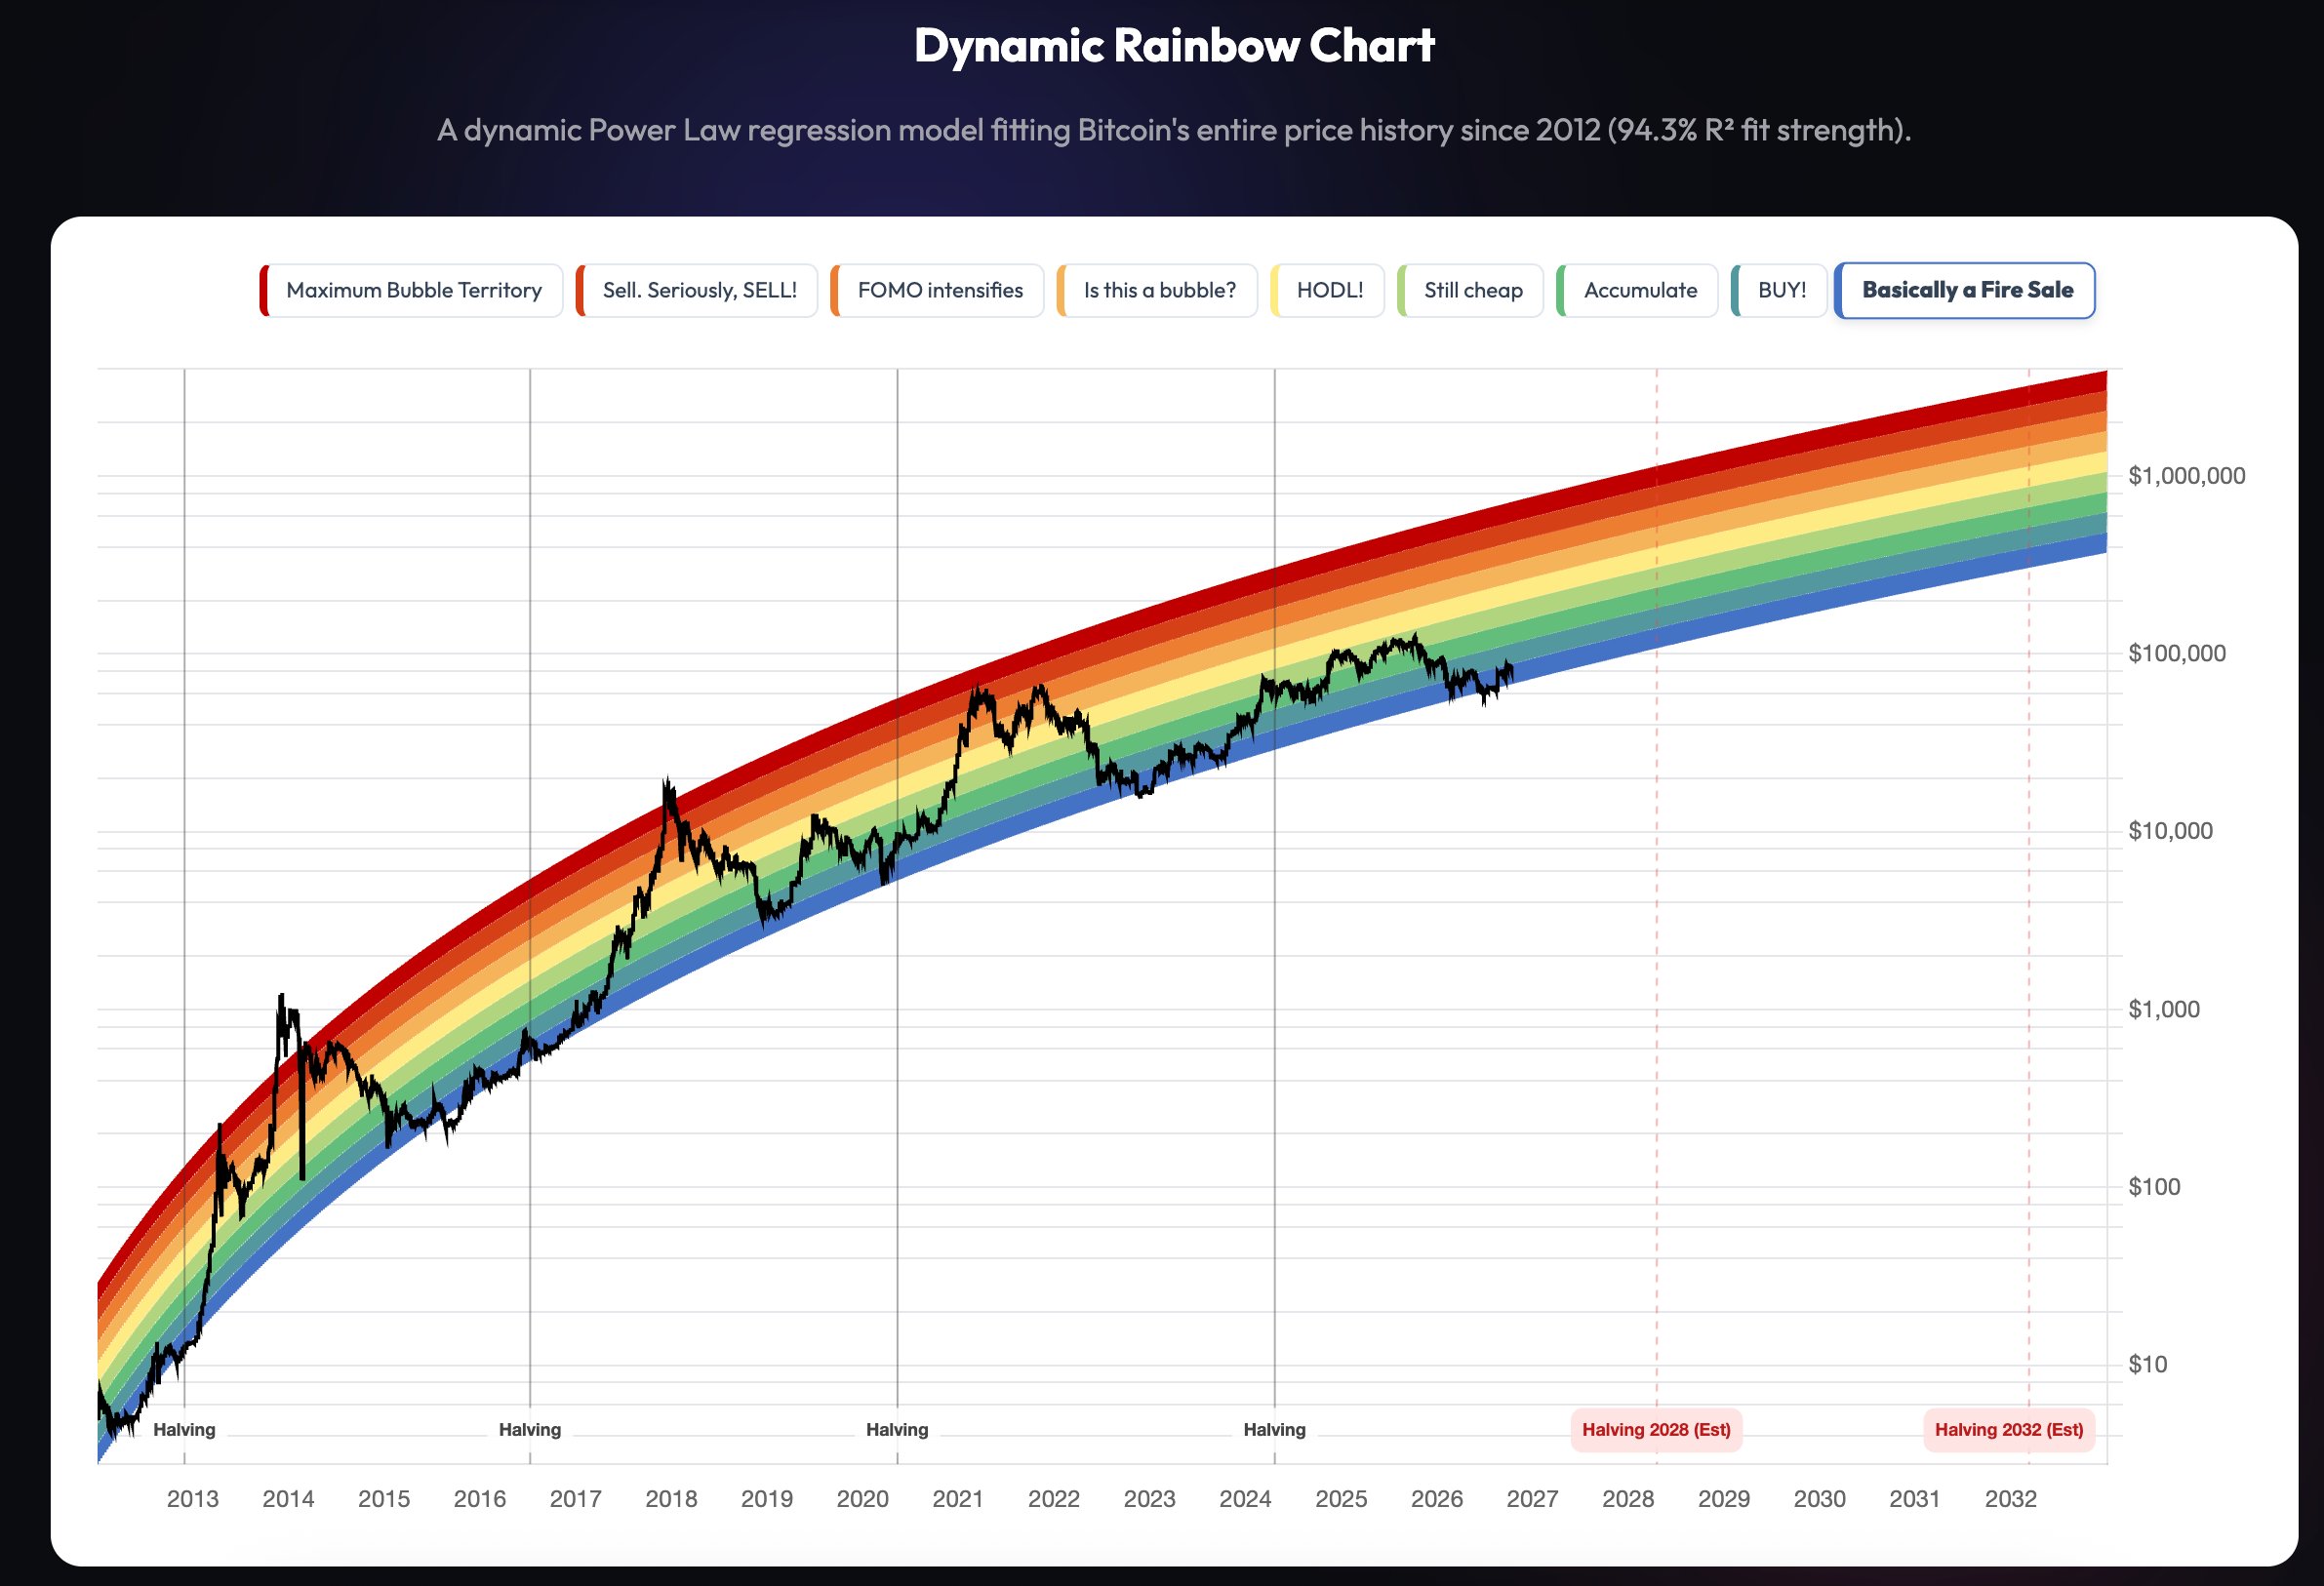
According to the article, Bitcoin's current trajectory in the Dynamic Rainbow Chart model is determined through rigorous power-law regression calculations. Since 2012, this model has had an accuracy rate of 94.3% in describing the behavior of this asset.

Currently, the price chart of BTC is almost at the very bottom of this mathematical “rainbow,” resting at the junction of the two ranges between “BUY!” and “Basically a Fire Sale.” From the perspective of this model, the price has been compressed to its limit, offering investors the greatest discount relative to its fair value; at the same time, the theoretical peak for the next round of market overheating has already far exceeded one million US dollars.
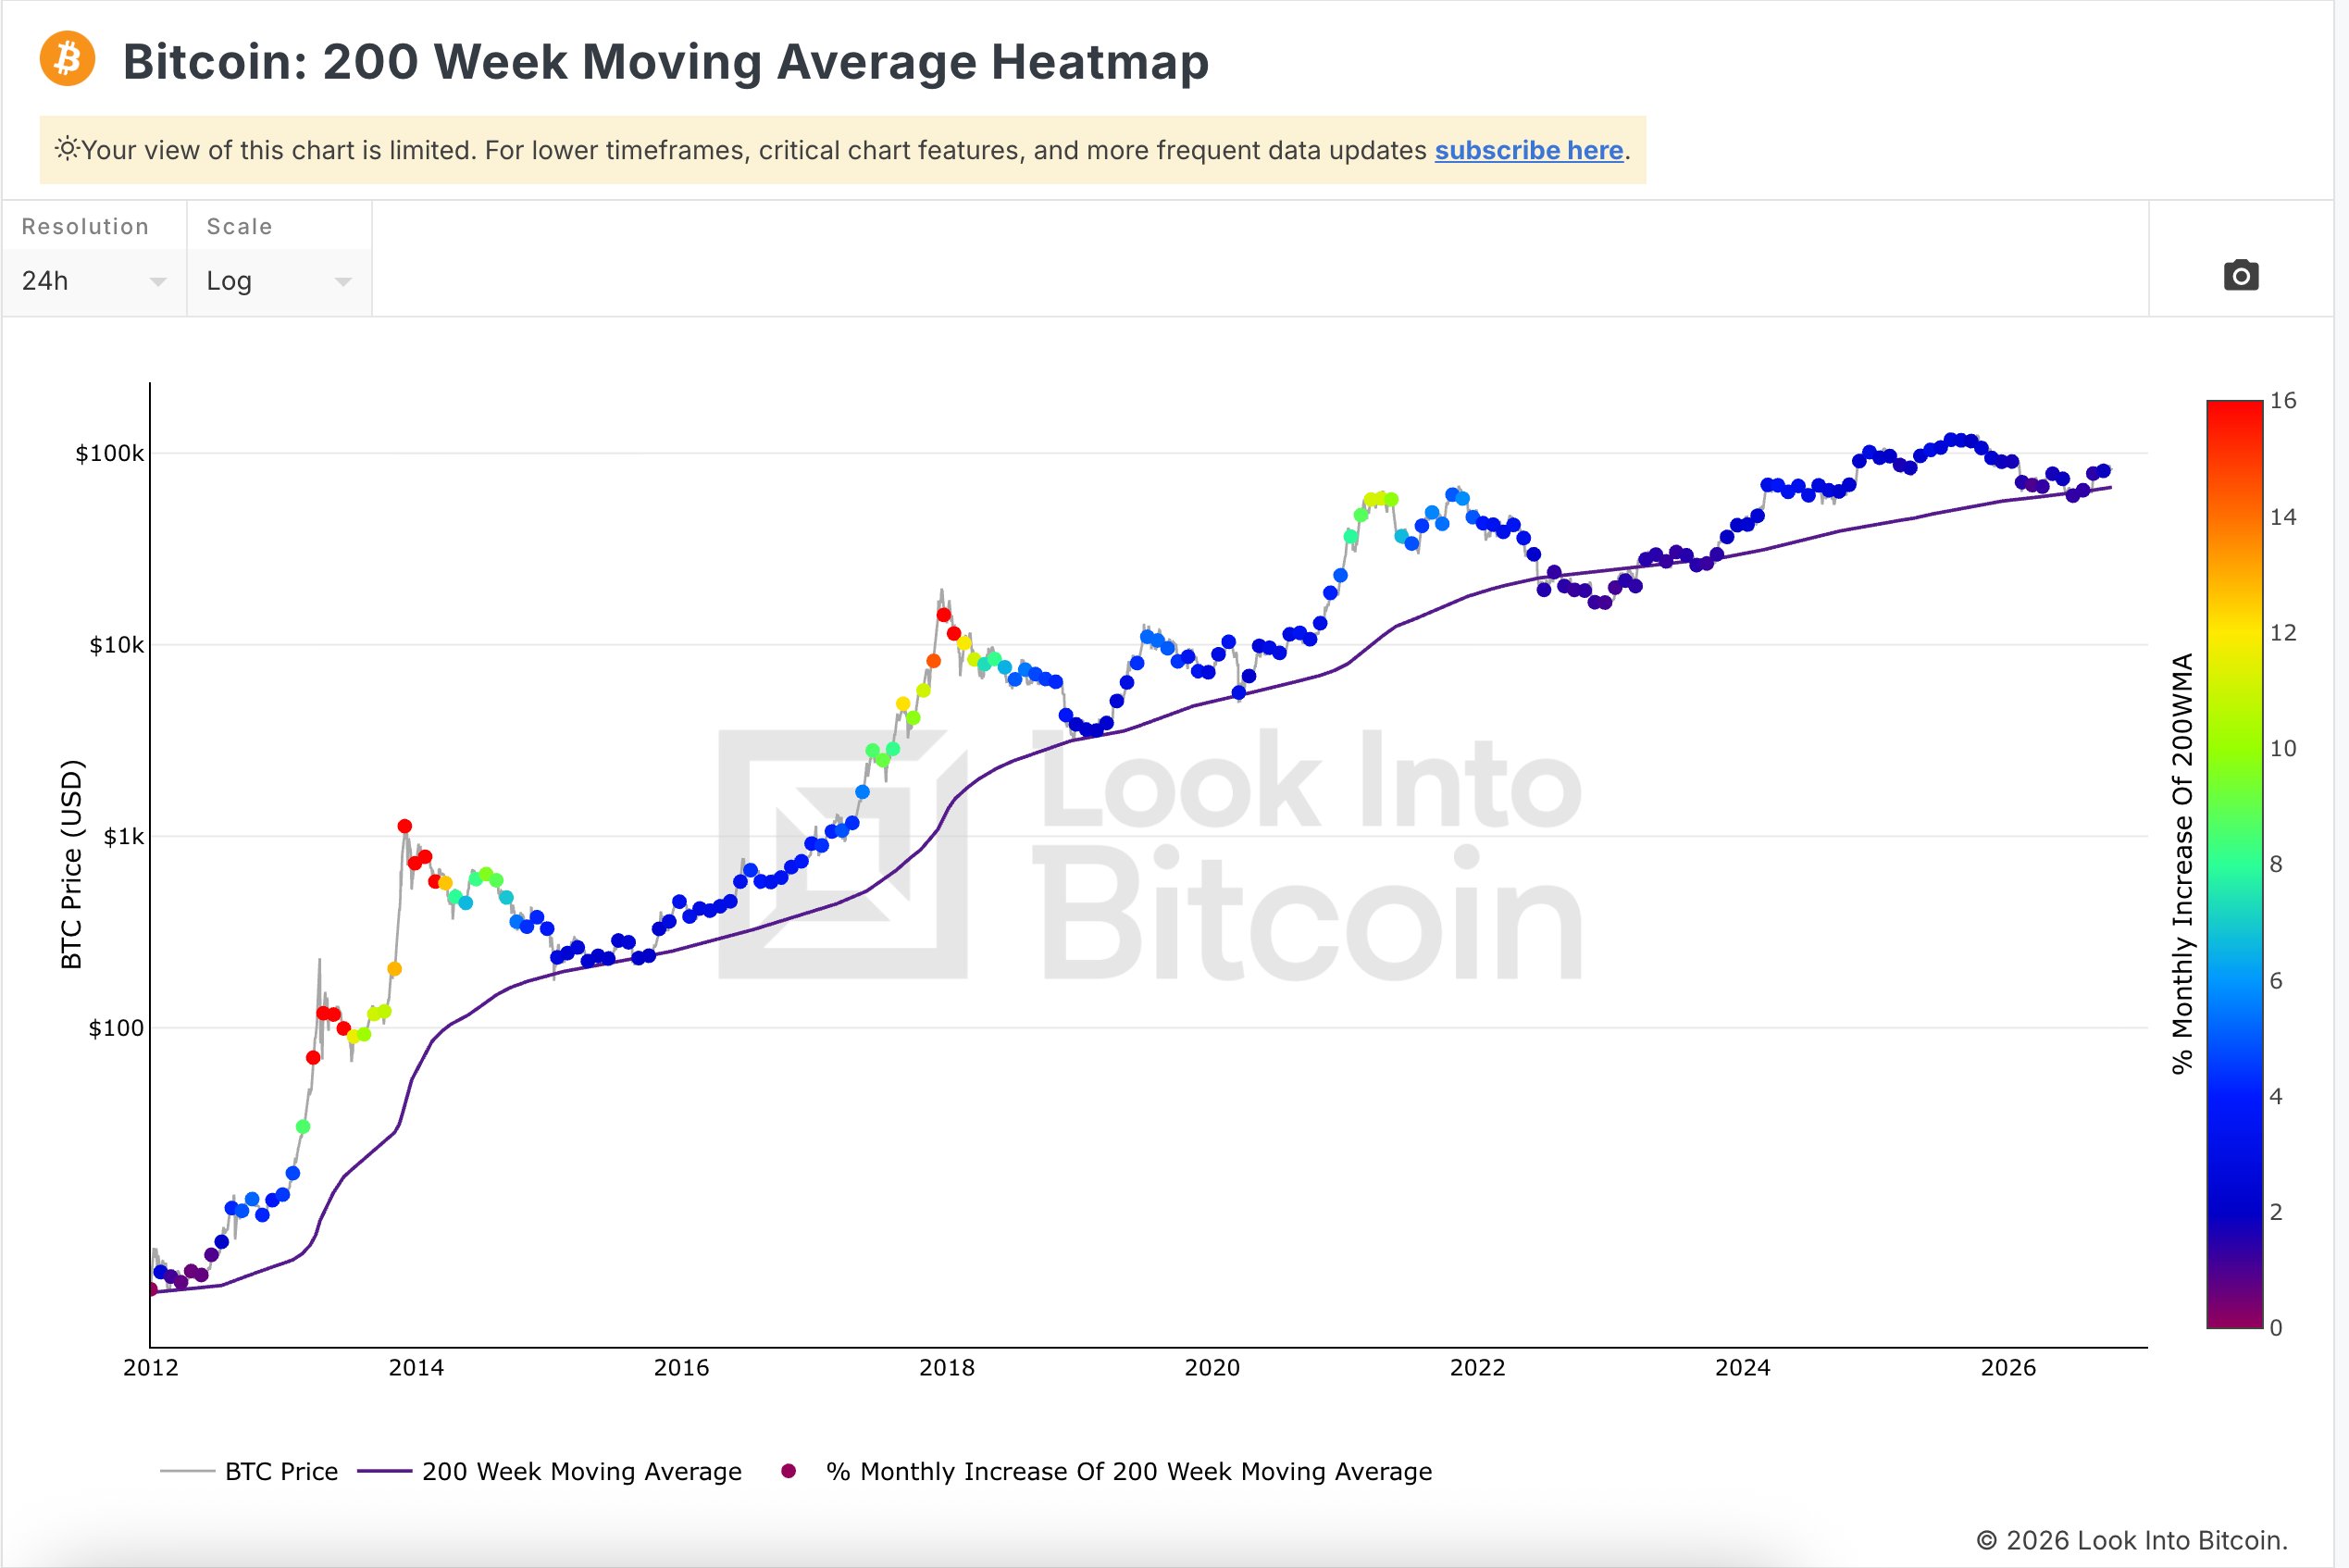
The second independent argument supporting the formation of a global bottom is the 200-week moving average heat map developed by Look Into Bitcoin. This indicator assesses the growth rate of this 4-year support line and colors the chart points with a spectrum from purple to bright red.

The Green Light for “Whales”: Why a Boring Sideways Movement Is Actually the Best Friend of Investors

Throughout the history of Bitcoin, it has only fallen to this level at four key moments, all of which coincided with the most pessimistic market sentiment: in 2015, 2018, 2020, and 2022. Now, the chart indicator has once again turned a cold blue color.

The article states that for the market, this is a major sign of stability, confirming that speculative bubbles and excessive leverage have been completely squeezed out of the system, and panic has given way to calm waiting.

The synchronization signal emitted by Dynamic Rainbow and 200WMA proves that the long-term trend has completely broken away from short-term market noise. The article suggests that while retail investors are feeling exhausted due to the lack of sharp fluctuations, large funds are taking advantage of this period of calmness to create their own advantages.

For investors who adopt the DCA (determined investment) method, the article states that these boring sideways periods, which fall within the “blue” zone, have always been the strongest trigger signals to build positions calmly before the start of a new upward trend.

Tip
$0
Like
0
Save
0
Views 22
WalletJYS reminds readers to view blockchain rationally, stay aware of risks, and beware of virtual token issuance and speculation. All content on this site represents market information or related viewpoints only and does not constitute any form of investment advice. If you find sensitive content, please click“Report”,and we will handle it promptly。
Submit
Comment 0
Hot
Latest
No comments yet. Be the first!
Related
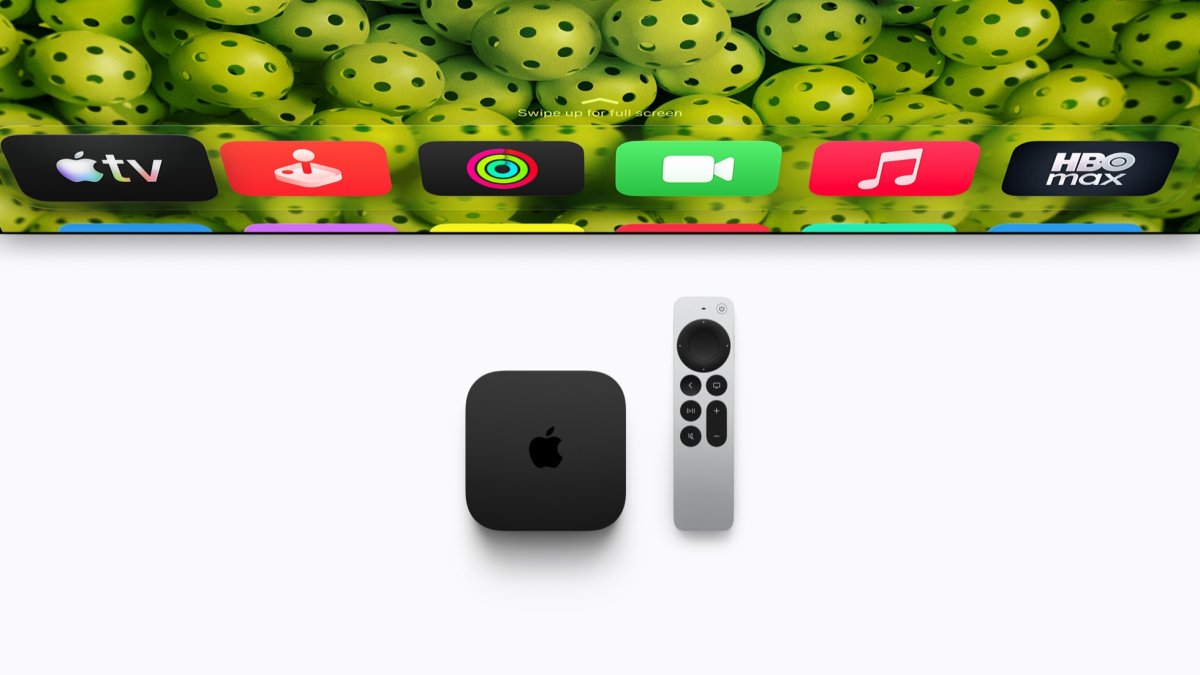
Apple releases new Apple TV 4K models, adding Siri AI and remote-free voice control
Apple today released a new model of the 299-dollar Apple TV 4K, equipped with an upgraded A19 chip, a new version of Siri AI for content discovery, and a microphone that allows users to issue voice commands directly without a remote control. The device will be available on November 13th, and pre-orders are now open starting today.
TechCrunch
·2026-10-13 21:43:20
1
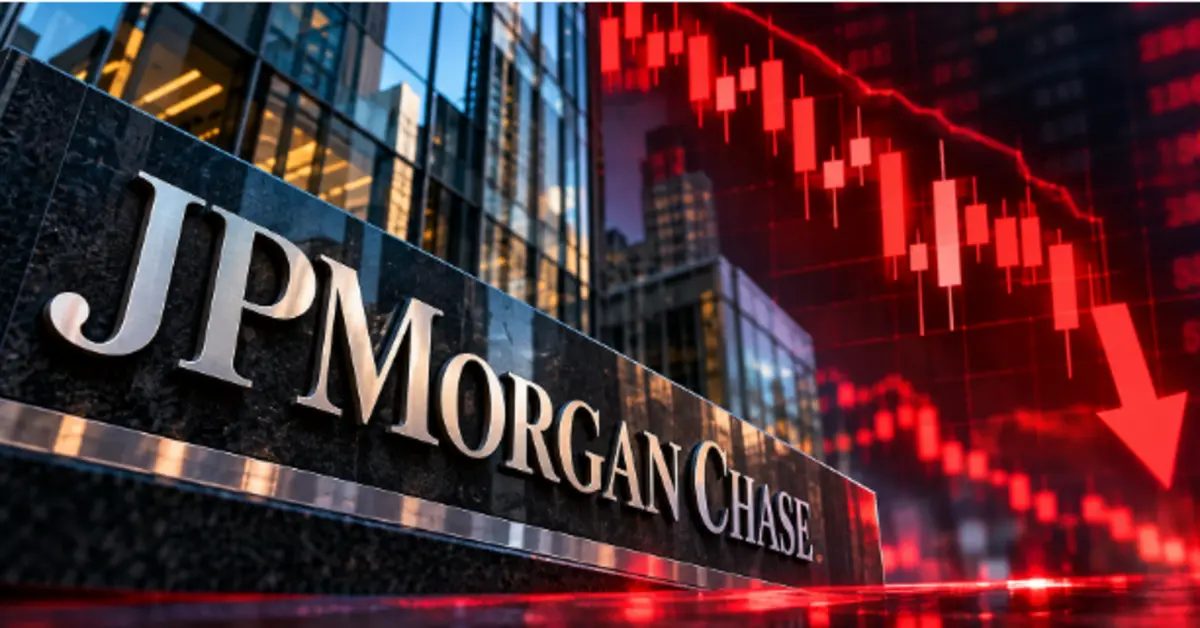
JPMorgan's stock price outlook weakens, third-quarter performance falls short of Wall Street's expectations
JPMorgan Chase's third-quarter performance fell short of expectations, with both revenue and earnings per share below Wall Street's forecasts. The slowdown in its investment banking business has also raised concerns about the sustainability of growth. Despite solid performance in trading and net interest income, the stock price has retreated to a key support range, with $320 to $325 becoming the focus of market attention.
Coinpedia
·2026-10-13 21:43:17
0
Moody's assigns investment-grade country ratings to Trafigura Group's brokerage and SOFIPO subsidiaries in Mexico
Trafalgar Group stated that Moody's has assigned the Mexican national rating to its two main regulated entities in Mexico: TRF Casa, de, and Bolsa have received a rating of BBB + mx, while Trafalgar SFP has received a rating of BBB.mx. The outlook for all is stable. The group also mentioned its intention to participate in the US and Mexican securities markets, but such actions still depend on regulatory approvals, document signings, and market conditions, among other factors.
PR Newswire
·2026-10-13 21:43:15
0
Goldman Sachs: The capital expenditure cycle of AI is approaching a turning point; two of the three major risk signals for U.S. stocks have already appeared.
Goldman Sachs senior macro trader Bobby Molavi stated that the dependence of the U.S. stock market on a few large technology stocks is deepening, and market divergence, rising financing costs, and the risk of slowing capital expenditure growth AI are accumulating. He believes that among the three signals indicating whether the AI investment cycle is approaching a turning point, the divergence between stock prices and earnings, as well as the repricing in the credit market, have already appeared, while the slowdown in capital expenditure growth remains to be verified.
Wallstreetcn
·2026-10-13 21:43:14
2
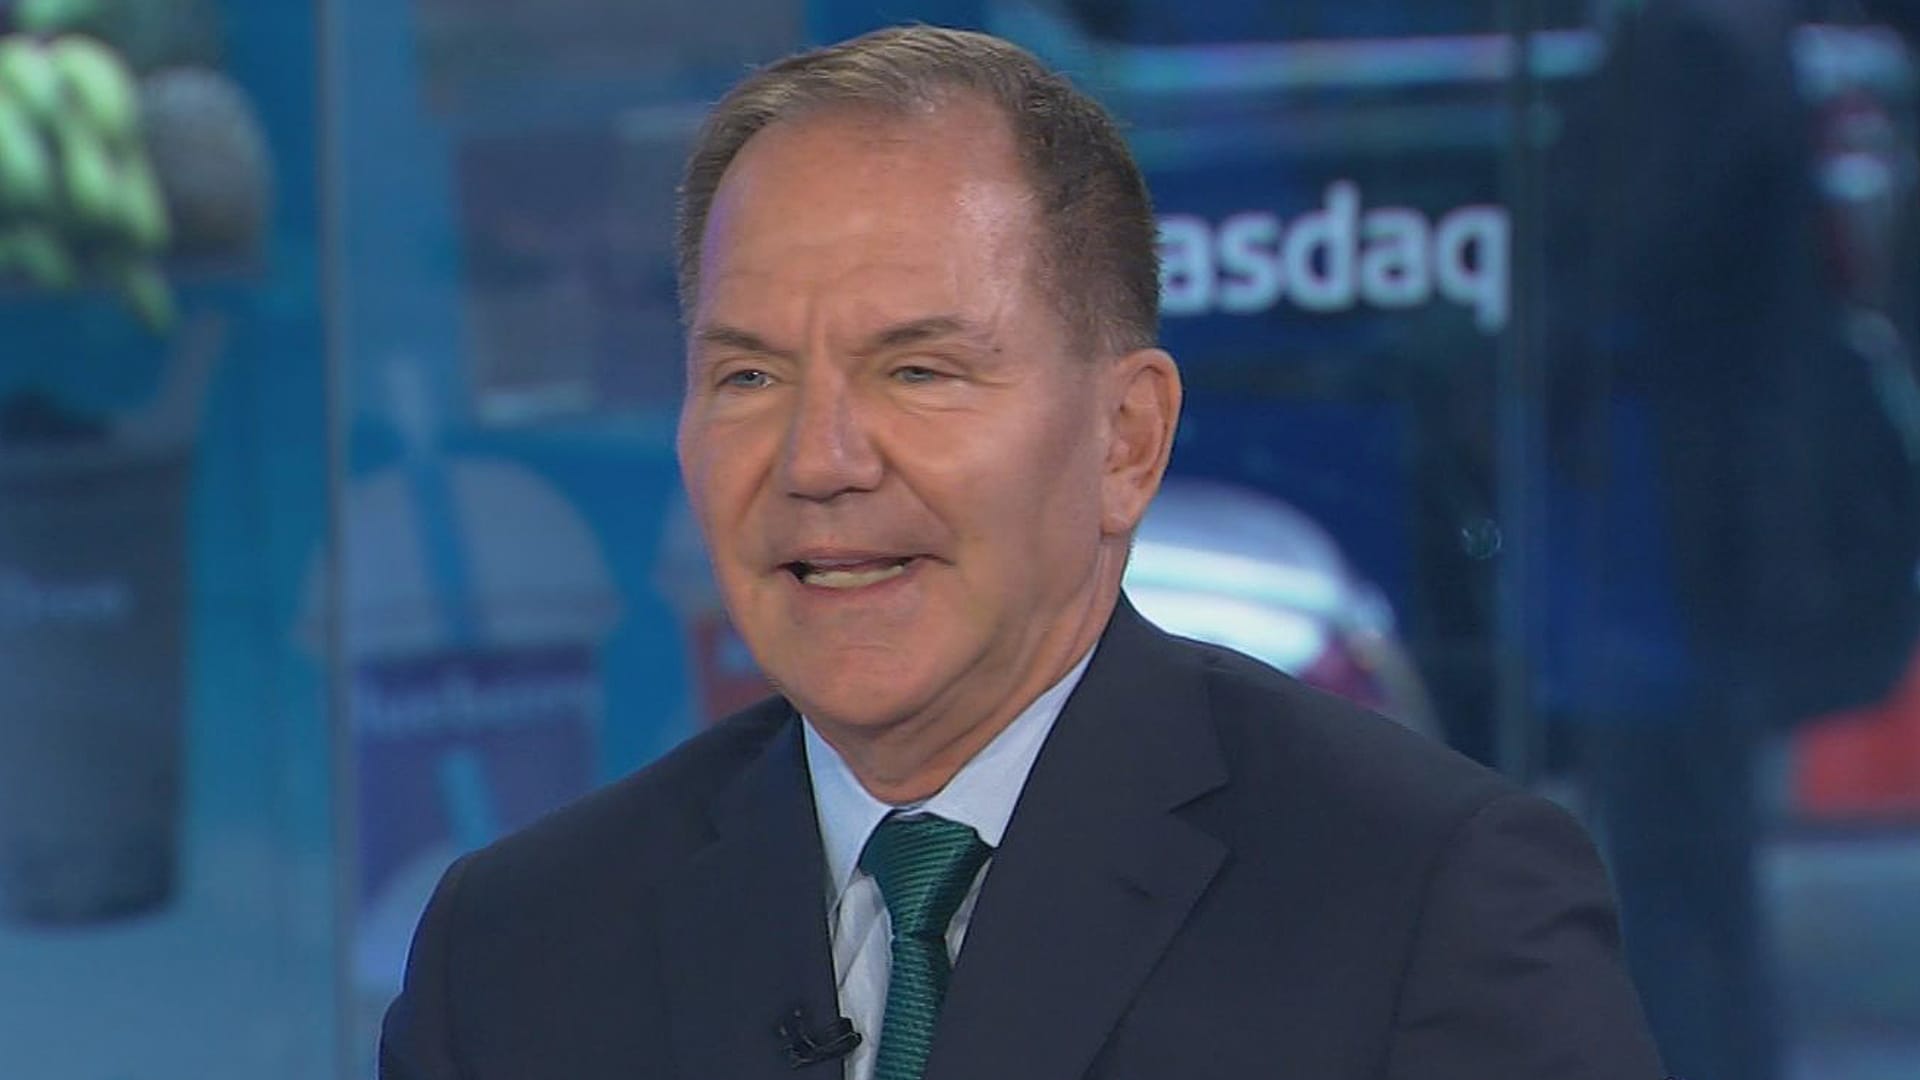
Paul Tudor Jones Says 2027 May Be a "Very Difficult" Year for the Stock Market
Legendarary hedge fund manager Paul Tudor Jones told CNBC that due to the increased stock supply brought about by large technology companies IPO, 2027 could be a "very, very difficult" year for the stock market. He also stated that the current negative supply environment facing the U.S. stock market might be the worst since 2002.
CNBC
·2026-10-13 21:32:44
9
View More