

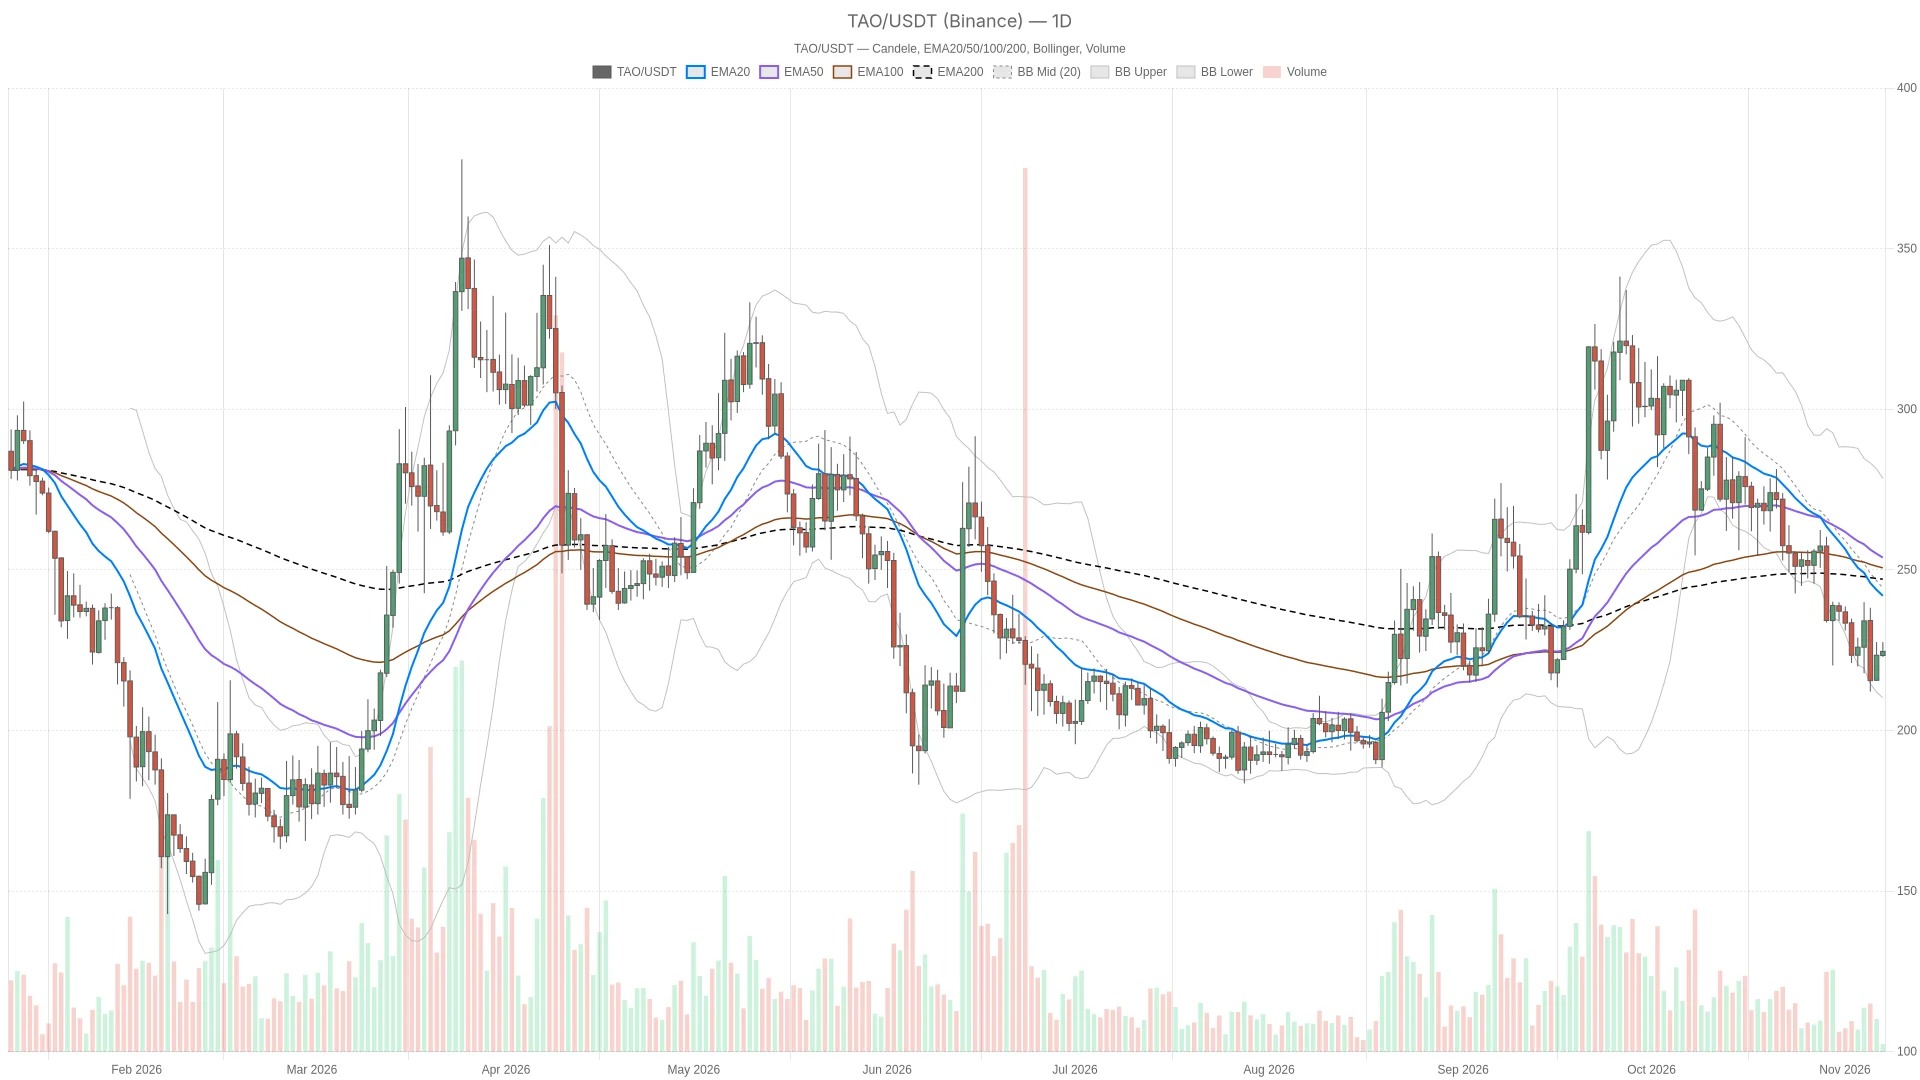
As of November 7, 2026, TAO was trading at $224.60 on Binance, above the daily pivot point, but still below the three-day moving averages. The main scenario is neutral with a defensive bias: support is still in place, however, the current structure is not sufficient to be considered a bullish reversal.
Key Points
- TAO remains above the daily pivot point of $222.13, but is still below the three daily EMA. The daily trend remains defensive.
- It is necessary for the daily close to be above $228.77, which is marked as R1, in order to confirm a corrective breakout; if the close is below $222.13, then the focus will shift to $216.77, which is marked as S1.
- The hourly RSI is at 47.4 and is on the decline, and the hourly MACD bar chart has turned negative, which weakens the possibility of a short-term recovery.
TAO The price scenario depends on the daily pivot point and the daily R1.
The daily pivot point of $222.13 is the nearest daily support, while the daily R1 of $228.77 is the nearest daily resistance. The previous completed daily candlestick closed at $223.40, which means that there has been no confirmation of a breakdown below the daily level, nor has there been a confirmation of an upward breakout.
Bullish scenario: If the daily close is above $228.77, which is the R1, it will constitute a corrective breakout and open up space to test the daily level of $243.74 ($EMA20). However, if the daily close falls below the daily pivot point of $222.13 again, then this scenario will not hold. Even if the breakout is confirmed, it will initially only be a repair to the damaged daily structure, and not proof that the upward trend has fully resumed.
Bearish scenario: If the daily close falls below the daily pivot point of $222.13, attention will shift to the daily S1 of $216.77, followed by the lower band of the daily Bollinger Bands at $211.89. However, if the daily close rises above the R1 of $228.77, then this bearish scenario will be invalidated.
From an execution perspective, the hourly pivot point of $224.33 is below the current price, but the previous completed hourly candlestick closed at $224.10, which is already below that level. Therefore, any subsequent recovery above this pivot point can only be considered unconfirmed. Above that, the hourly EMA20 at $224.65 and the hourly R1 at $225.07 narrow down the potential recovery range; below, the hourly S1 at $223.37 also serves as another support level.
In addition, the most likely false signal is mistaking a brief hourly recovery for a daily reversal. Since the daily ATR level is at $16.22, the distance between nearby daily levels is not significant relative to the intraday fluctuation range. A mere touch or intraday breakthrough does not meet the closing confirmation criteria specified in the text.
RSI lacks bullish conviction; short-term MACD is weakening.
RSI still has some downward space, but has not yet entered oversold territory.
The daily line RSI is at 36.9, the hourly line RSI is at 47.4, and the 15-minute line RSI is at 42.4; none of them have entered the oversold zone. The daily line reading indicates a defensive bias, while the hourly reading is on the decline, which hardly provides any confirmation for a continuous recovery. The sequences of the daily line and the 15-minute RSI lines are not consistent, therefore neither is sufficient to support a clear judgment that "momentum is improving."
MACD Distinguishes between daily line hesitation and intraday pressure
On the daily chart MACD, the bar chart shows negative values, and there is no clear change in direction among the completed readings provided. This makes the daily chart outlook weak, but it does not indicate that downward momentum is accelerating. On the hourly chart, the bar chart has fallen below the zero line and continues to decline; on the 15-minute chart, the bar chart is negative and is expanding in size. In practical terms, shorter time frames are more indicative of renewed pressure rather than confirming a sustained upward turn.
The sparse arrangement of hourly moving averages limits the room for improvement.
On the daily chart, the price is below EMA20 at $243.74, EMA50 at $254.99, and EMA200 at $247.31. These moving averages are not neatly aligned, which fits a "neutral but defensive" daily chart pattern, rather than the textbook-style bearish alignment. TAO requires more than just a small intraday rebound to resolve this separation.
At the same time, the hourly price is around EMA20 $224.65, but it is lower than EMA50 $224.92 and also lower than EMA200 $230.59. The hourly moving averages are bearish in alignment. The 15-minute price is also below all three moving averages, indicating a bearish structure as well. Therefore, this period further reinforces the weak trend at the hourly level, rather than challenging it.
The daily Bollinger Bands range is from $211.89 to $281.35, with the central axis at $246.62. Since the price is still in the lower half of this range, returning to the daily central axis can only be considered a conditional recovery target, rather than the current trend. The hourly Bollinger Bands are centered around $224.89, with a range of $223.39 to $226.39; the hourly ATR is $1.88. The 15-minute Bollinger Bands are centered around $224.90, with a range of $223.91 to $225.89, and the ATR is $0.7539. These narrower intraday ranges define the current fluctuations, but they do not eliminate the risk of larger daily fluctuations.
Extreme fear sets the tone for a defensive market environment.
The Fear & Greed Index for Alternative.me is 25, indicating a state of “extreme fear.” CoinGecko shows that the total market value of cryptocurrencies is approximately 2.57 trillion US dollars, with Bitcoin accounting for 59.31%. This emotional reading is consistent with the defensive interpretation of the current structure of TAO, but it does not necessarily mean that a rebound will occur.
Frequently Asked Questions
Is the daily structure of TAO more bullish or bearish?
The main scenario is neutral but with a defensive tendency: the price remains above the daily pivot point, yet it is still below the three daily EMA levels.
Has a shorter cycle confirmed a reversal?
No. The hourly MACD bar chart has turned negative, and the 15-minute bar chart is also negative and continues to show a downward trend. As of now, there is no confirmation of a permanent fix for either.
What could render a bearish scenario invalid?
If the daily close is above $228.77, which is the R1, it will invalidate the bearish breakout scenario and open the possibility of a recovery towards the daily EMA20 of $243.74.
This article was generated with the assistance of artificial intelligence and has been reviewed by an editorial team.
Lorenzo Marcek is a financial journalist and senior crypto market analyst, renowned for his clear, data-driven reporting on digital assets. With a background in economics and over a decade of experience covering global markets, he focuses on on-chain indicators, institutional adoption trends, and macroeconomic factors that drive changes in the crypto market. His work combines investigative journalism with technical market insights, making him a trusted source for traders seeking solid, actionable analysis.