

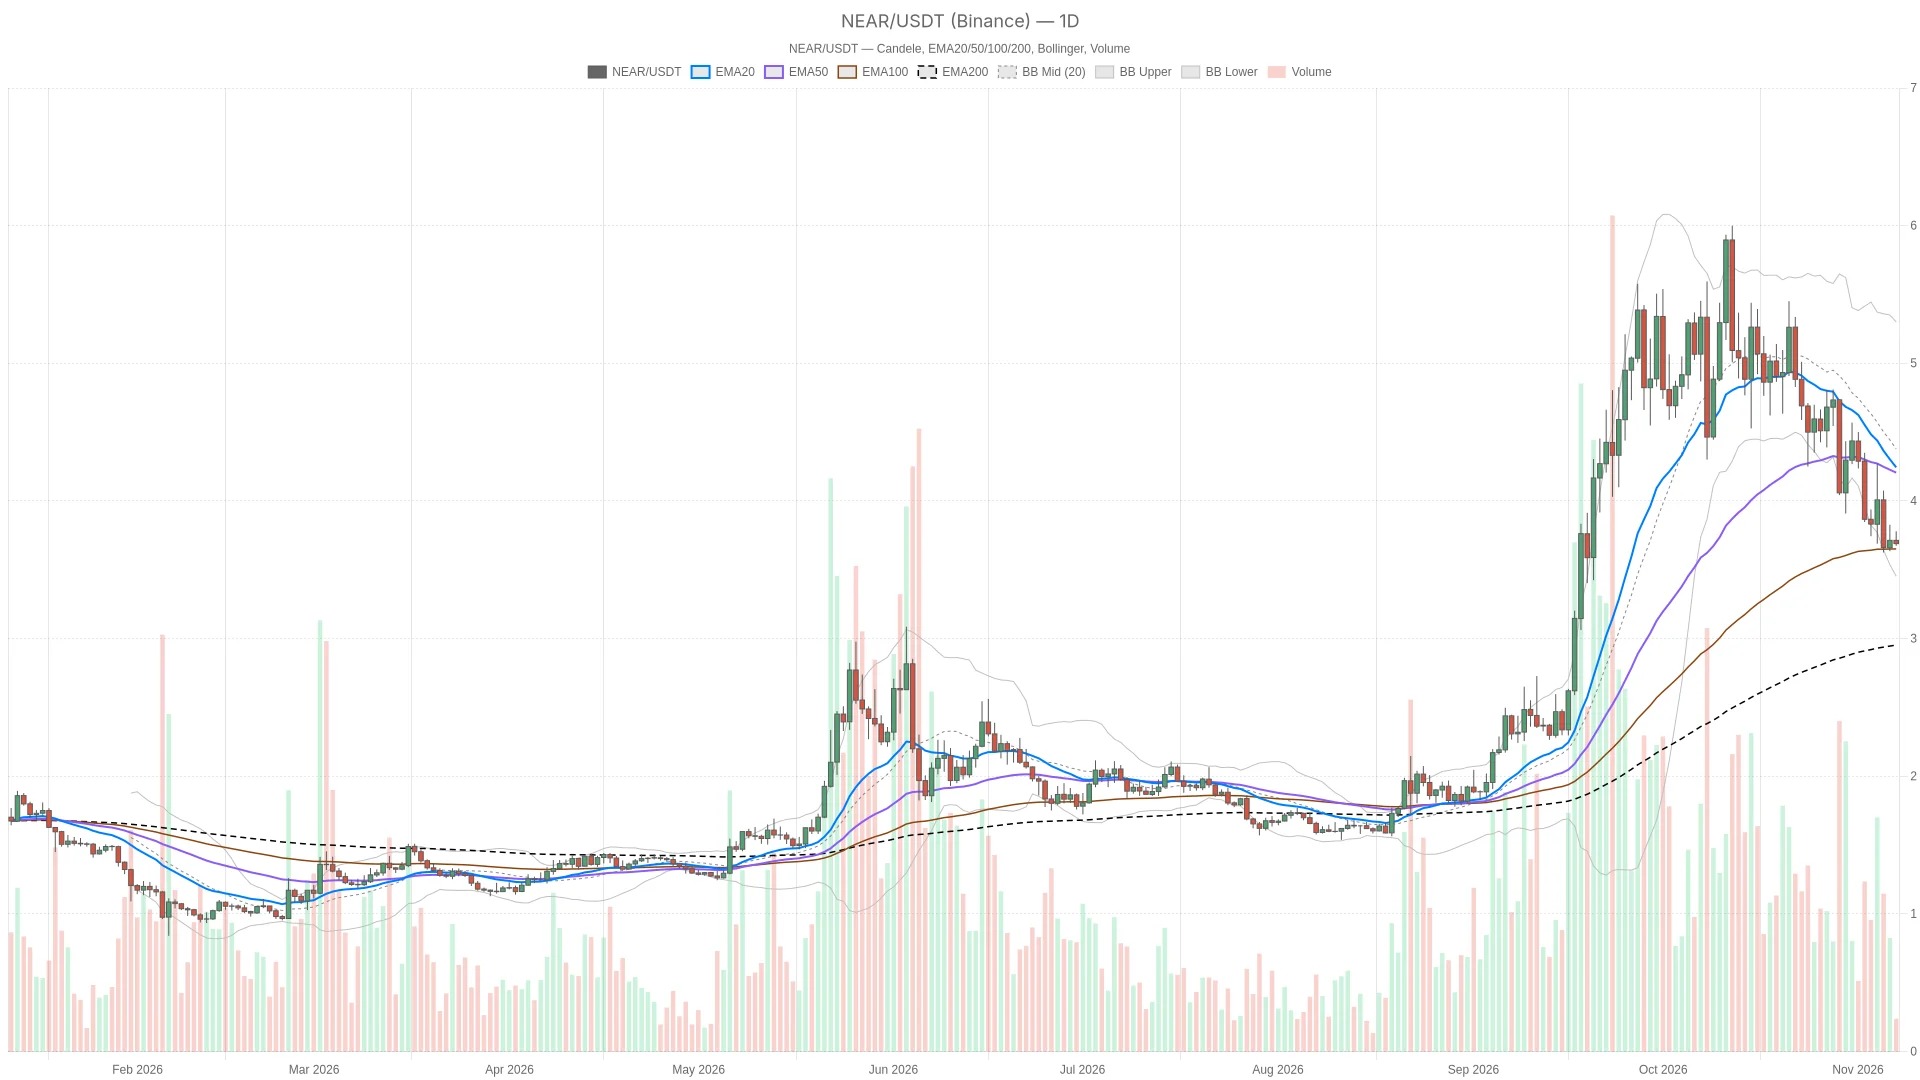
As of November 7, 2026, NEAR is trading at $3.69 in Binance. The short-term trend is relatively defensive. The daily chart structure remains neutral: the price is below both the short-term and medium-term moving averages but above the long-term moving average, indicating that it is still in a correction phase, and the larger-scale trend has not yet been disrupted.
Key Points
- NEAR is trading at $3.69 in Binance, below the hourly pivot of $3.70 and the daily EMA20 level of $4.30.
- A closing price of $3.71 above R1 at the hour level is a bullish trigger condition; however, a closing price below $3.68 at S1 would be even more bearish.
- The daily, hourly, and 15-minute RSI levels are 39.0, 41.0, and 41.8 respectively. The momentum is weak, but it has not reached an oversold extreme.
- On the daily chart, there are still relatively many EMA entries, but the price is lower than that of EMA20 and EMA50.
- The Fear and Greed Index is at 25, indicating "extreme fear," with the total market value of cryptocurrencies falling by 2.85%, reinforcing a cautious sentiment.
The immediate direction of NEAR depends on its ability to hold the hourly level of $3.68 for S1, or to re-establish itself above $3.71 for R1 at the close of the hour. The current price is below the hourly pivot point of $3.70, but the previous completed hourly candlestick closed above that level. Therefore, the current decline cannot yet be considered a confirmed break below the pivot point. The nearest resistance above is at $3.71 for the hourly R1, while the nearest support is at $3.68 for the hourly S1.
In a bullish scenario, if the hourly close exceeds $3.71, prices are expected to rebound to the daily pivot level of $3.73; if the rebound continues further, the daily R1 level of $3.82 will become the next reference point. If the hourly close falls back below $3.70 again, then this short-term recovery scenario will not hold. Even if a rebound occurs, it will initially just be a temporary bounce and not a reversal of the daily downtrend.
In a bearish scenario, if the hourly close falls below $3.68, the bearish logic will strengthen, and prices could drop to $3.62, which is the S1 of the daily chart, followed by the lower band of the daily Bollinger Bands at $3.54. If the hourly close manages to rebound above $3.70, then this immediate breakout scenario will become invalid.
The main risk of false signals is when prices briefly rebound above the hourly resistance level but ultimately fail to hold above the daily pivot point. Conversely, if prices fall below support during the session but do not close below that level on an hourly basis, it can only be considered as weak evidence of a continuation of the trend. These price levels are all within the daily range of fluctuations; therefore, a single small fluctuation should not be misinterpreted as a sign that a larger structural change has occurred.
RSI is weak, and MACD has signal conflicts across different time periods.
The momentum indicator does not indicate a oversold reversal signal; the expansion of the hourly MACD bar chart is more noteworthy than the narrowing of the bars on the 15-minute chart.
RSI does not provide any basis for a reversal from overselling.
The readings from Binance for RSI are as follows: 39.0 on the daily line, 41.0 on the hourly line, and 41.8 on the 15-minute line. All three are below the central axis, but none have entered the oversold zone. The daily line readings are mixed, the hourly RSI is sideways, while the 15-minute sequence is weakening. Therefore, the momentum is still weak, but there have been no extreme readings that would strengthen the mean reversion logic.
Hourly MACD weakened, overshadowing the initial improvements at the execution level.
On the daily chart MACD, the bar charts show negative values, and the recent trend has been classified as sideways movement. This supports a defensive outlook for the daily chart, but it does not indicate a new direction of acceleration. On the hourly chart, the negative bar charts are expanding, meaning the values continue to decline; the bearish momentum in this time frame is strengthening, and this is precisely the time scale that determines the current trading structure.
On the 15-minute chart, the bar graph is still negative, but it is converging towards zero. This is the most obvious counter-signal to the bearish judgment on the hourly chart, indicating that the downward momentum at the execution level is weakening. However, this does not mean that a bullish crossover has already occurred; at the same time, it is inconsistent with the continued downward trend of the 15-minute RSI, so the evidence for a rebound is still incomplete.
The daily line EMA arrangement is still in place, but the price is still below the repair band.
The daily trend remains neutral, as the price is below EMA20 and EMA50. However, EMA200 is at $2.95, indicating that the long-term support level is still intact. The daily structure of EMA is still bullish, but the current price is lower than the daily levels of $4.30 for EMA20 and $4.23 for EMA50, while it is still above the $2.95 level of EMA200. This defines a neutral macro-trend: the moving averages are still biased towards the upside, but the current price action does not confirm this.
On the hourly chart, the price is below EMA20 at $3.73, EMA50 at $3.77, and EMA200 at $4.00, indicating a bearish pattern. On the 15-minute chart, the price is also below all three moving averages: EMA20 at $3.71, EMA50 at $3.72, and EMA200 at $3.78, which also presents a bearish trend. Therefore, these short-term patterns weaken the argument that a small rebound could represent a lasting recovery.
The lower Bollinger Band on the daily chart is at $3.54, the middle band at $4.44, and the upper band at $5.35. The price is in the lower half of the range, significantly below the middle band. The hourly price is slightly below its lower band, while the 15-minute price is still within the Bollinger Bands but also below the middle band. Local dips and broader structural weakness can exist simultaneously; however, the position of the Bollinger Bands does not guarantee a reversal.
ATR: On the daily chart, it is $0.4347; on the hourly chart, it is $0.04422; and on the 15-minute chart, it is $0.01683. These readings indicate that several closely spaced pivot points in the vicinity need to be understood within the context of volatility: breaking through a local price level is far less significant than repairing the daily chart structure.
The issuance cap reduction was approved, but the performance of on-chain trading activities varies.
On November 3, 2026, NEAR approved a proposal to reduce the token issuance cap to 1.6%. This change in supply growth provides context, but the technical indicators are still on the defensive side; the approval alone does not indicate that a bottom has been formed in prices.
The 24-hour trading volume on the blockchain amounted to 150,763,844.46 US dollars. The performance of various platforms varied: one platform saw a daily increase of 8.04%, another decreased by 30.24%, and yet another increased by 17.78%. These are the trading volume figures for the entire blockchain, not the token revenue or transaction fees of a particular token, nor do they indicate that there was a synchronized expansion in activity.
Extreme fear has intensified the defensive market context.
The Fear and Greed Index is at 25, indicating "extreme fear"; CoinGecko shows that the total market value of cryptocurrencies is 2.57 trillion US dollars, with a 2.85% decline in the past 24 hours, and Bitcoin accounts for 59.31%. This context is consistent with the current defensive structure of NEAR, but it does not explain the reason for the decline in NEAR, nor can we determine the direction of Bitcoin's proportion.
Frequently Asked Questions
Has the daily trend of NEAR completely turned bearish?
No. The daily trend remains neutral: the price is below the daily levels EMA20 and EMA50, but above EMA200, and the moving averages still show a bullish arrangement.
Has the short-term momentum improvement confirmed a reversal?
No. Although the 15-minute MACD bar chart is narrowing, it remains negative; however, the hourly negative value bar chart is expanding. The recovery scenario still depends on the hourly closing price staying above the R1 level.
This article was generated with the assistance of artificial intelligence and has been reviewed by an editorial team.