












As of November 12, 2026, Uniswap ( UNI ) was trading at $5.98 in Binance. The price structure of Uniswap remains neutral on the daily time frame, but there is a clear downward bias. The price is below the shorter-term moving average and still above the daily EMA200, which puts pressure on the larger time frame structure, although it has not yet clearly turned bearish.

Key Points
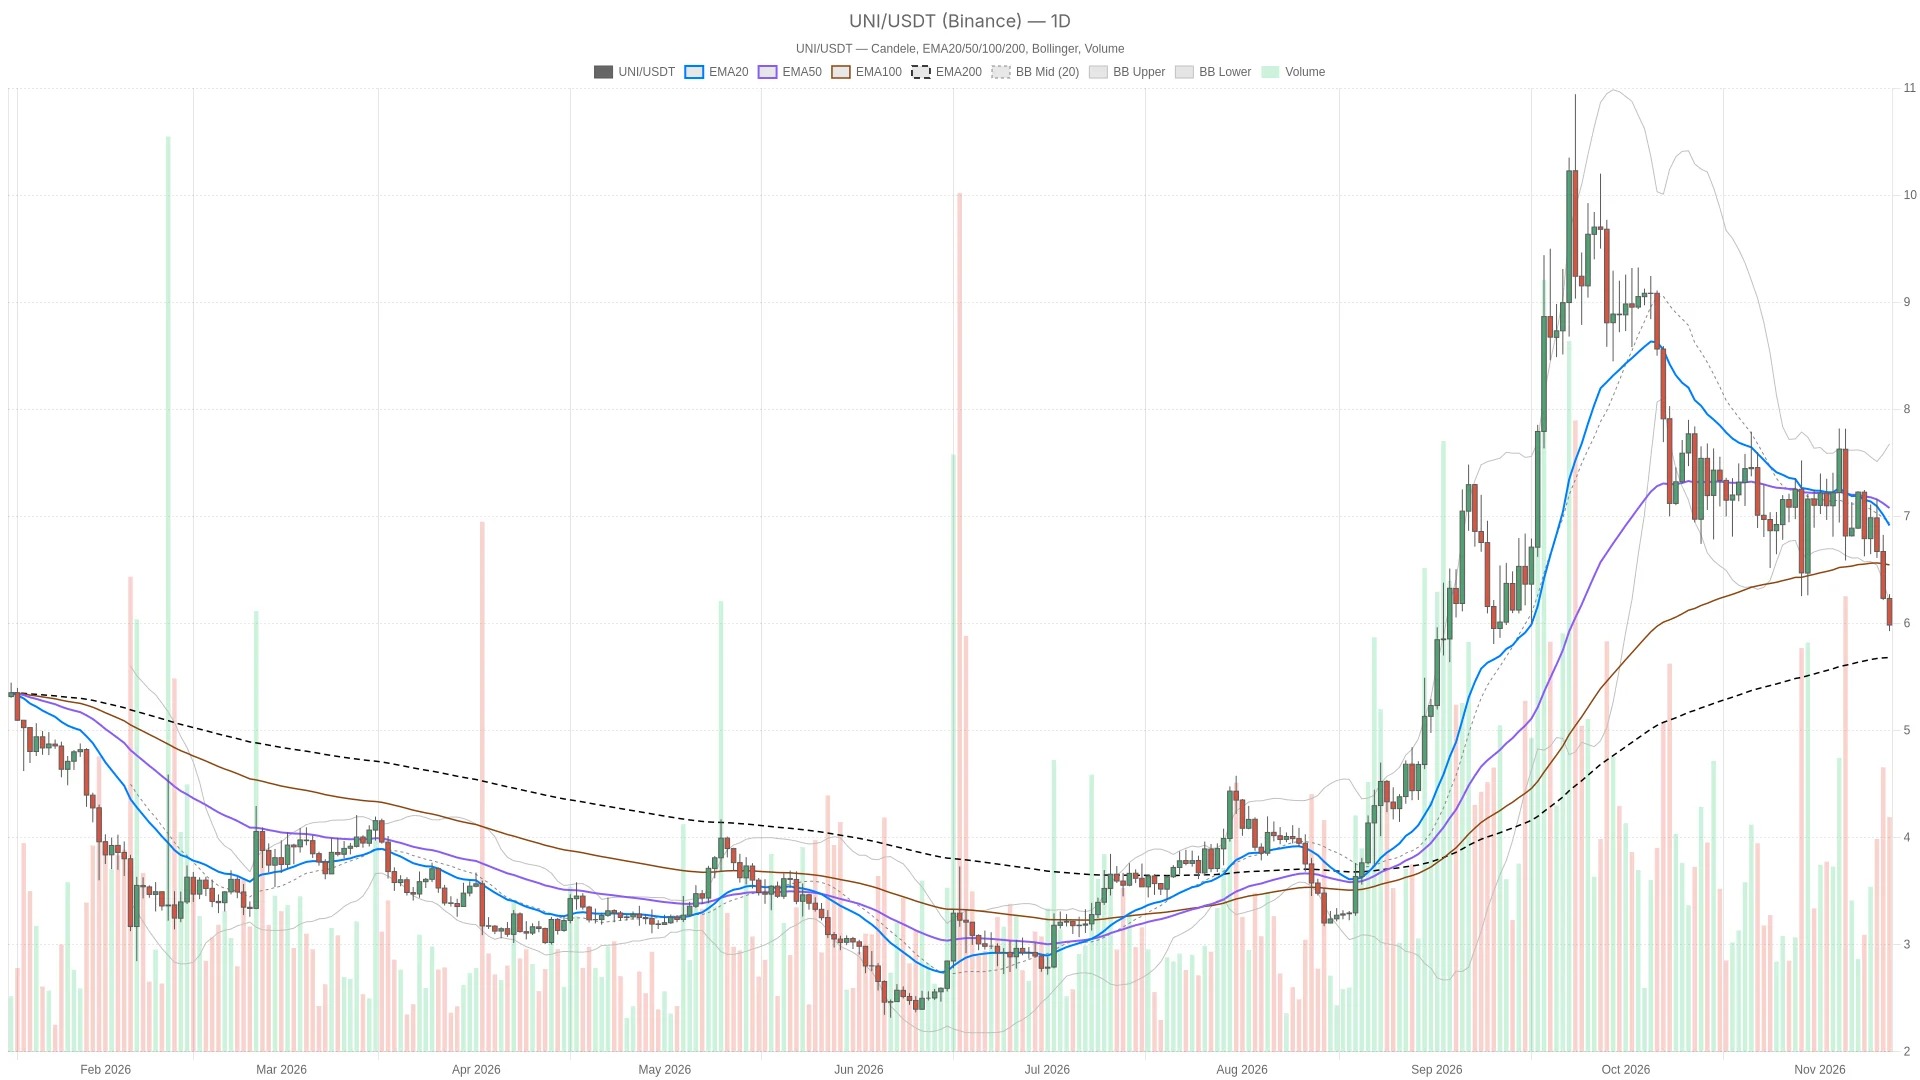
- UNI reports $5.98; the daily chart structure is neutral, but tends to be downward.
- The total market value of the crypto market fell by 5.66%, to $2.42 trillion, with the Fear and Greed Index at 28.
- The hourly RSI is in oversold territory, reporting at 27.5; the daily line RSI reports at 38.9 and continues to weaken.
- The hourly pivot point of $6.00 is the key to distinguishing between a rebound and a renewed sell-off.
- On the daily chart, EMA200 is at $5.68, which represents the next structural support level below the current price.
The current tension lies in the conflict between the short-term bearish trend and the improvement in short-term momentum. This means that there is still room for a technical rebound in the market, but the existing evidence is not sufficient to consider it a lasting reversal. Compared to simply being in an oversold condition, it is more important to regain the nearby resistance levels.
Weaker markets on a broader scale provide a defensive context.
The broader crypto market is in a defensive stance: the total market value has dropped to $2.42 trillion, with a decline of 5.66% over the past 24 hours, and Bitcoin holds a dominant position of 59.60%. Meanwhile, the Fear & Greed Index is at 28, which falls within the “fear” range. Overall, these readings reflect a cautious environment, rather than one suitable for those with a high appetite for risk.
On November 6, 2026, UNI tested at $7.07, and at that time its daily trend was still neutral. Compared to that test, the current technical readings are weaker, and the previous tests could only provide context and do not constitute a new bullish catalyst.
Uniswap The daily price trend is neutral, with a bearish bias within the day.
The daily structure of UNI remains neutral, as the price is still above $5.68 of EMA200, despite the latter being below its shorter-term moving average. However, the hourly chart indicates a clear bearish trend: the price is below three hourly EMA, and the moving averages are arranged in a typical bearish pattern. This means that any initial rebound should be seen as a counter-trend movement, rather than confirmation of a larger-scale recovery.
Based on the daily readings of Binance, UNI is below EMA20's $7.01 and EMA50's $7.12, but still higher than EMA200's $5.68. The moving averages do not form a consistent pattern, which is why the daily classification remains neutral: there is a clear short-term weakness, but the price has not yet fallen below the long-term moving averages.
On the hourly chart, there is not much ambiguity. The price is below the levels of $6.16 on the EMA20 hourly chart, $6.38 on the EMA50 hourly chart, and $6.78 on the EMA200 hourly chart, and they are arranged in a bearish pattern, which further reinforces the downward trend. On the 15-minute chart, the price is also below these three levels, and the arrangement is bearish as well. Therefore, any improvement at the execution level must be judged in the context of the upper resistance levels, and it should not be misinterpreted as a change in the daily chart structure.
Hourly overselling momentum conflicts with deteriorating daily trends
The hour RSI is in an oversold range, at 27.5. The negative MACD bar chart is narrowing, which is conducive to a rebound. However, the daily line RSI has dropped to 38.9, and the daily line MACD bar chart has crossed below the zero axis and continues to decline. The daily momentum is still deteriorating, and it has not yet entered the oversold zone; therefore, there is no daily-level reversal signal that can offset the damage to the shorter-term structure.
The daily line RSI has dropped to 38.9, and the bar chart of the daily line MACD has crossed below the zero axis and continues to decline. The momentum is weakening, but there are no signs of oversold readings on the daily line yet, which means there is no daily reversal signal to offset the damaged short-term structure.
The hourly RSI is in a state of oversold, reporting at 27.5, but its recent trend has been relatively flat. Meanwhile, the negative bar chart for the hourly MACD is narrowing. In other words, the selling pressure during this period is easing, but this easing does not equate to a bullish trend.
A reading after 15 minutes increases the likelihood of a rebound: RSI is on the rise, at 44.1, and the MACD bar chart is expanding. The conflict here is clear: the momentum at the execution level is improving, while the daily momentum is deteriorating. For now, this supports the interpretation of mean reversion rather than a trend reversal.
The price has fallen below the lower band of the daily Bollinger Bands at $6.39, with the middle band at $6.99 and the upper band at $7.58. This indicates a downward expansion of prices, rather than a signal for automatic recovery. The hourly Bollinger Band range is between $5.96 and $6.33, and UNI is currently close to the lower edge. The daily ATR is at $0.59, the hourly ATR is at $0.10, and the 15-minute ATR is at $0.05. Compared to the nearby pivot points, these fluctuation ranges are not small; therefore, when there is a brief crossing of a certain level, it may appear more decisive on the surface than it actually is.
The hourly pivot point will indicate whether there will be a rebound attempt or if the trend will continue to weaken.
The hourly pivot point of $6.00 serves as the demarcation line between a technical rebound and a continuation of the downward trend. If the closing price at the hourly level remains above this point, it will trigger a rebound; however, if the closing price falls below $5.97 (the S1 level), it will lead to further weakness, with the target being $5.68 on the daily chart ($EMA200). Since the distance between these levels and the ATR level is very small, a confirmation at the closing price is more important than a touch during the session.
The most recent upper reference level is the hourly pivot point of $6.00. Above that are the daily pivot point of $6.02 ($S1) and the hourly pivot point of $6.03 ($R1). Although the daily pivot point of $6.43 ($S1) is nominally a support level, it actually acts as resistance when the current price is below it. Further above, the daily pivot point of $6.43 and the daily pivot point of $6.63 ($R1) constitute even greater resistance levels.
Bullish scenario: If the hourly close exceeds the hourly pivot point of $6.00, it will trigger a technical rebound structure, with targets set at $6.02 on the daily chart S1 and $6.03 on the hourly chart R1. If the hourly close falls below the hourly pivot point of $5.97 S1, then this structure will be invalidated. Even if the initial rebound is successful, the overall daily trend will remain neutral and will not immediately lead to a bullish reversal.
Bearish scenario: If the hourly close falls below the hourly S1 of $5.97, it will trigger a continuation of the downward trend, with the target being the lower band of the hourly Bollinger Bands at $5.96. Further down, the daily EMA200 of $5.68 represents the next structural support level. If the hourly close manages to rebound above the hourly pivot point of $6.00, then this immediate bearish structure will become invalid.
The most likely false signal is when the price briefly touches the hourly pivot point and surges upwards with the support of improved 15-minute momentum, but then is rejected below the next resistance level. Since these levels are quite close to ATR, a closing price confirmation is more significant than a touch during the session.
Frequently Asked Questions
Is the main daily trend for UNI bearish?
The daily chart classification remains neutral, but tends to be downward. The price is below the shorter-term moving average, yet it is still above the daily EMA200. Moreover, the moving averages have not formed a consistent arrangement.
Has the oversold momentum in the hours confirmed a bottom?
No. Oversold readings and narrowing hourly MACD negative bars suggest the possibility of a rebound, but the structure during hours with relatively weak momentum EMA still does not support calling it a confirmed reversal.
See also: Uniswap UNI Futures launched, providing regulated hedging token options for institutions · Uniswap UNI Exchange reserves reach a record of 113.9 million tokens
This article was generated with the assistance of artificial intelligence and has been reviewed by an editorial team.
Lorenzo Marcek is a financial journalist and senior crypto market analyst, known for his clear, data-driven reporting on digital assets. With a background in economics and over a decade of experience covering global markets, he specializes in on-chain indicators, institutional adoption trends, and macroeconomic factors that influence crypto market volatility. His work combines investigative journalism with technical market insights, making him a trusted source for traders seeking solid and actionable analysis.