












Ethena The price is facing bearish resistance around $0.1395, while there are attempts at a short-term rebound. The subsequent trend will depend on the key hourly closing levels.

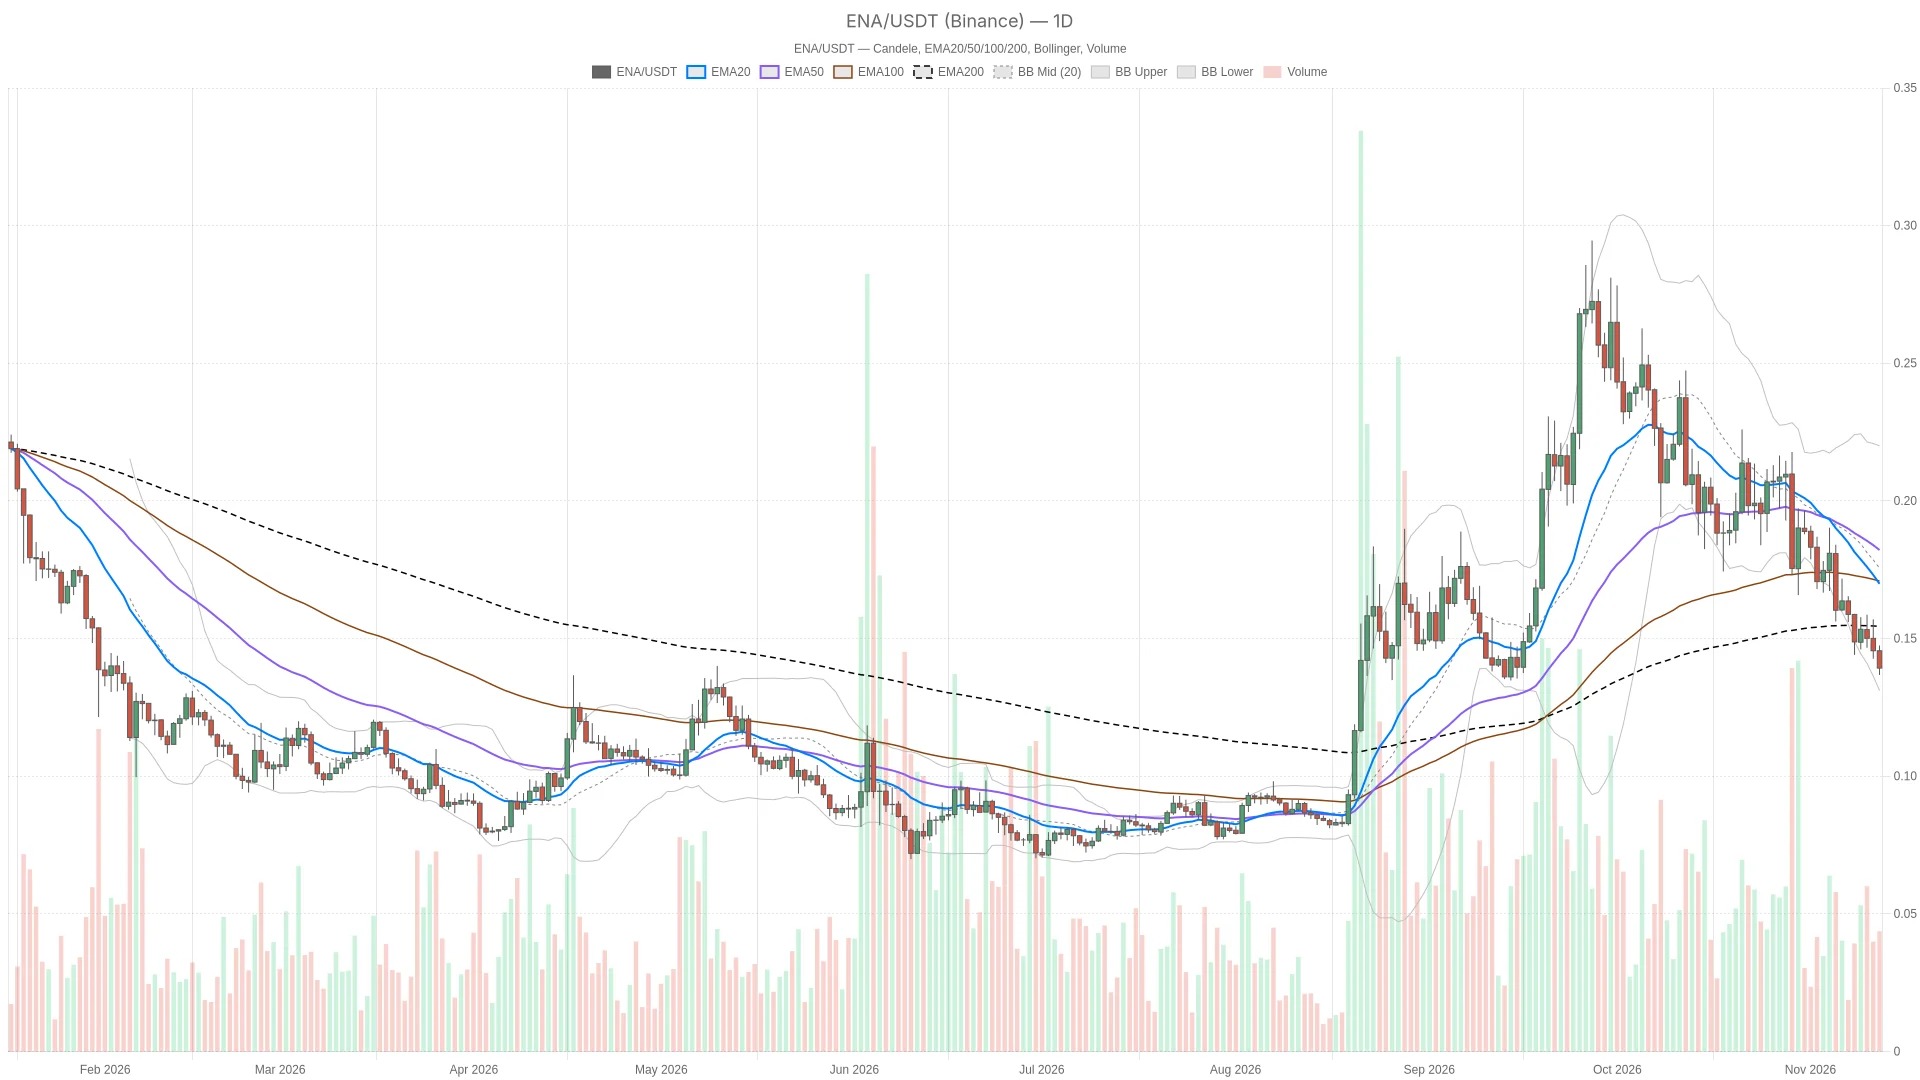
As of November 12, 2026, ENA was trading at $0.1393 in Binance. Although there have been short-term rebound attempts, the price structure of Ethena still indicates a bearish trend on the daily chart. The price remains below all major daily moving averages, and the momentum at the hourly level has entered an oversold state.
Key Points
- ENA is trading at $0.1393 in Binance, below all major daily moving averages, and the daily chart structure remains bearish.
- To form a bullish scenario, the hourly close must exceed $0.1395; if the close falls below $0.1385, it may continue to decline to $0.1364.
- The hourly RSI is at 22.8, which is in an oversold range; the daily RSI is at 34.2, still above the oversold threshold, which limits the credibility of any potential rebound.
- The Fear & Greed Index is at 28 (fear), and the total market value of cryptocurrencies has fallen by 5.66%, to 2.42 trillion US dollars.
- The $100 million BlackRock BUIDL liquidity facility in collaboration with Securitize has been launched, but the charts have not yet reflected any price changes.
The daily indicators do not show an accelerated decline: the negative MACD bar chart is narrowing. However, the daily RSI is still on the downward trend, and the hourly trend remains bearish. For now, it is more likely to be a attempt at a counter-trend recovery rather than a confirmed reversal.
Ethena The price scenario depends on the hourly resistance of $0.1395.
The bullish scenario requires the hourly closing price to be above $0.1395, while the bearish scenario is triggered when it falls below $0.1385. As of the most recent hourly closing price of $0.1388, neither condition has been met.
Bullish scenario: If the hourly close exceeds the level of $0.1395, it will confirm a preliminary breakout above the recent resistance level. The next test level is the daily level of $0.1399; although the name suggests support, it actually acts as resistance above the current price. If this level is broken through, it will strengthen the bullish scenario, with the target being the middle band of the hourly Bollinger Bands at $0.1422. If the hourly close falls below the hourly pivot point of $0.1385, then this bullish scenario will not hold.
Bearish scenario: If the hourly close falls below the hourly pivot point of $0.1385, the hourly S1 of $0.1379 will become a focus of attention, followed by the lower band of the hourly Bollinger Bands at $0.1373 and the lower band of the daily Bollinger Bands at $0.1364. If the hourly close stays above the hourly R1 of $0.1395, then this immediate downward continuation scenario will not hold true.
The daily pivot point of $0.1484 remains a reference level for a broader rebound, while the higher daily R1 is at $0.1542. Therefore, a local hourly-level breakout will not alone reverse the bearish tone on the daily chart. In this structure, the most likely false signal would be a brief break above the hourly R1 only to be stopped below the daily S1. A oversold condition allows for a rebound, but it does not mean that a lasting support has been formed.
Hourly RSI overselling and short-term trading MACD improvement are contradictory to each other
The RSI indicator is in an oversold state at 22.8, while the 15-minute MACD bar chart has crossed above the zero axis, creating a mixed signal that suggests a temporary rebound rather than a trend reversal.
The daily line RSI is at 34.2 and is still on the decline, while the hourly line RSI is at 22.8, also continuing to fall within the provided completed data. Only the hourly reading is in an oversold range. This combination suggests that there is room for price mean reversion, but it does not indicate that the weakness in the daily line has ended.
In 15 minutes, RSI is rebounding to 48.4. This provides a backdrop at the execution level for the rebound, but it is still below the central axis; in other words, the shortest-term cycle is recovering faster than the longer-term cycle, but a broader reversal of momentum has not yet been confirmed.
MACD provides a less pessimistic counterbalance. The bar charts at the daily and hourly levels are still below the zero axis, but they are narrowing, indicating that the downward trend is weakening rather than turning positive. The 15-minute bar chart has already crossed above the zero axis and continues to rise. Overall, these readings support the interpretation of a "relieving rebound," while the still-negative bar charts at higher time frames do not support considering it as a new bullish trend.
The daily moving average is still above, but there is still room for volatility to rebound.
All three daily charts EMA are significantly above the current price, which indicates that the trend remains defensive. Although it is close to the lower Bollinger Bands at $0.1364, there is still room for a short-term rebound.
Prices are below the daily averages of EMA20 $0.1731, EMA50 $0.1839, and EMA200 $0.1546. These moving averages do not form a textbook example of a bearish alignment, but since they are above the price levels, they still tilt the daily trend towards a defensive direction. The mixed arrangement of these moving averages is important; it reflects a weak price structure, rather than a perfectly aligned daily trend signal.
The situation on the hourly chart is even clearer. The price is below the levels of EMA20 $0.1424, EMA50 $0.1465, and EMA200 $0.1576, and the moving averages are arranged in a bearish pattern. On the 15-minute chart, the price is above EMA20, but below EMA50 and EMA200; this moving average structure is also bearish. Therefore, the short-term recovery has only broken through the fastest-moving average.
The daily Bollinger Bands range is from $0.1364 to $0.2209, with the middle band at $0.1786. The price being close to the lower band intensifies the tension between downward pressure and the potential for a rebound; merely being close to the lower band of the Bollinger Bands does not mean that that point is the bottom.
The daily ATR is $0.01801, the hourly ATR is $0.002479, and the 15-minute ATR is $0.001399. These volatility readings indicate that the distances between nearby pivot points are quite narrow: when the price crosses a certain threshold, it does not necessarily mean that a larger structural change has occurred.
The liquidity facility news for Ethena has not yet reversed the weak chart trend.
The $100 million BlackRock BUIDL liquidity facility in collaboration with Securitize has been launched, but the charts have not yet shown price reactions sufficient to change the bearish structure.
The $100 million BlackRock BUIDL liquidity facility for Securitize and Ethena has been launched. This provides some context for the related projects, but the data provided does not indicate any price reaction in the market to this event. ENA still requires technical confirmation; one cannot make a bullish judgment based solely on this news.
Fear sentiment and a smaller crypto market set the backdrop for a rebound attempt
The Fear and Greed Index is at 28, and the total market value of cryptocurrencies has declined. This defensive environment is putting pressure on the rebound attempts of ENA.
The Fear & Greed Index for Alternative.me is 28, classified as “Fear.” CoinGecko shows that the total market value of cryptocurrencies is 2.42 trillion US dollars, with a 5.66% decline in the past 24 hours, and Bitcoin holds a dominant position of 59.60%. This context is consistent with a defensive risk appetite, but it does not explain the specific reasons for the fluctuations in ENA.
Frequently Asked Questions
ENA Is it always oversold in all cycles?
No. The hourly level at RSI is in a oversold state, yet the daily line reading is still above the oversold threshold, while the 15-minute reading is in the process of recovery. An oversold signal at the hourly level does not equate to a confirmation of a reversal on the daily line.
Why does the daily chart S1 act as resistance?
In the current snapshot, the daily line S1 is above the current price. Regardless of what this level is called, its position relative to the price makes it act as an upper resistance.
This article was generated with the assistance of artificial intelligence and has been reviewed by an editorial team.
Lorenzo Marcek
Lorenzo Marcek is a financial journalist and senior crypto market analyst, renowned for his clear, data-driven reporting style on digital assets. With a background in economics, he has been covering global markets for over a decade, focusing on on-chain indicators, institutional adoption trends, and macro-driven fluctuations in crypto assets. His work combines investigative journalism with technical market insights, making him a trusted voice for traders seeking solid, actionable analysis.