












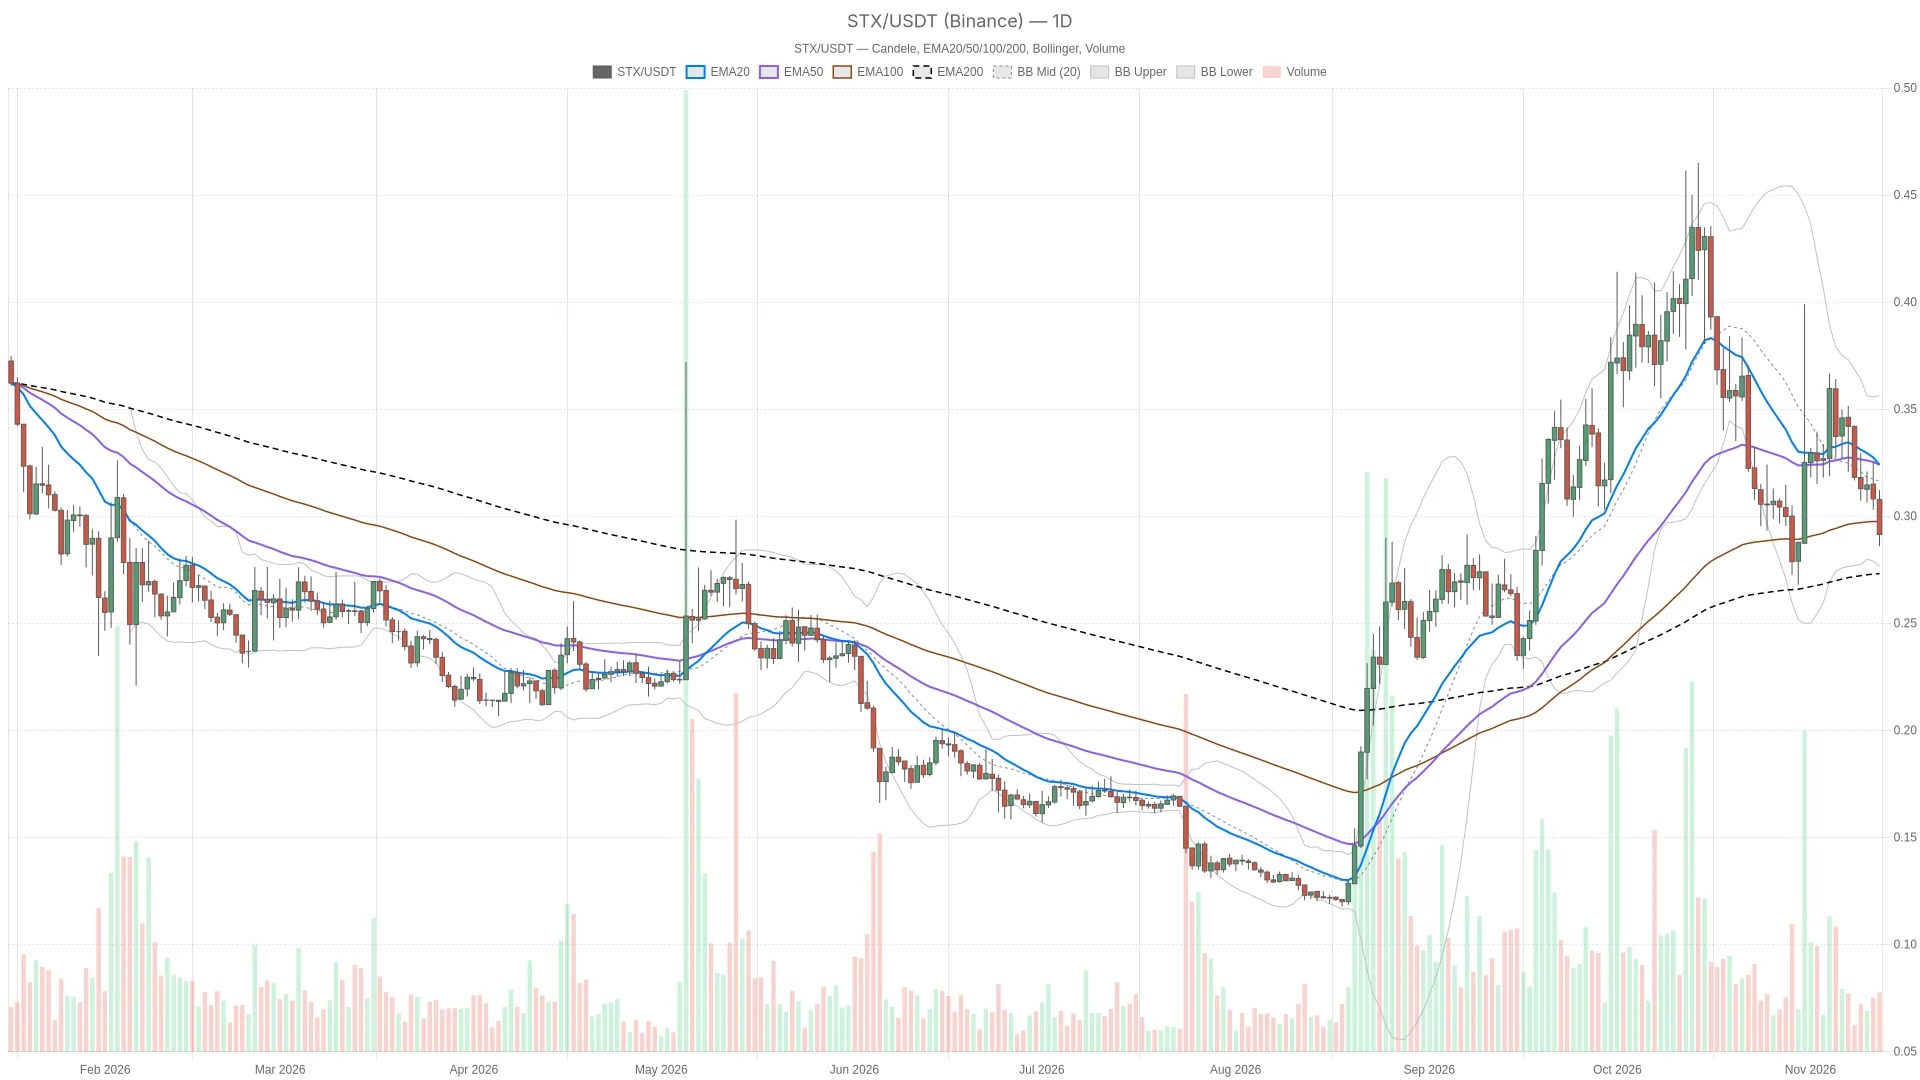
As of November 12, 2026, Stacks is trading at $0.2915 in Binance. The price structure of Stacks remains neutral to weak on a daily basis, with a bearish tendency in the short term. The price is still above the daily EMA200, but below the shorter-term moving averages, which helps to maintain the integrity of the larger-scale structure; however, recent selling pressure is dominant.

Key Points
- Stacks trades at $0.2915, with a neutral daily trend and bearish momentum on the hourly time frame.
- The hourly chart needs to close above $0.2920 to enter a bullish scenario; if it falls below $0.2906, a bearish scenario will be triggered.
- The daily line RSI is at 42.7, and the bar chart of MACD is declining, weakening the possibility of a sustained rebound.
- The price is still above the daily level of $0.2730 for EMA200; the larger-scale daily structure remains intact.
Stacks The price scenario depends on the hourly pivot level and the S1 support level.
The hourly chart further indicates weakness, while the 15-minute chart only shows preliminary signs of recovery. The short-term direction depends on whether the price can close above the hourly pivot point of $0.2920, or fall below the hourly support level of $0.2906.
The scenario requires that the hourly close price exceed the 0.2920 USD hourly pivot level. The previous completed hourly candlestick closed exactly at this level, so it remains to be observed. If the price re-crosses above this level, the 0.2934 USD level for the hourly R1 will come into focus. However, if the hourly close price falls below the 0.2906 USD level for the hourly S1, then this corrective structure will become invalid.
The bearish scenario is activated when the hourly close falls below $0.2906, at which point the price may test the lower band of the hourly Bollinger Bands at $0.2871. If the hourly close manages to rebound above the pivot level of $0.2920, then this immediate bearish scenario will become invalid. These are merely short-term scenarios and do not imply that the daily trend has been definitively established.
On the daily chart, the level of $0.2990 for the daily S1 has now become a resistance level, although its name typically indicates support. Above that is the daily pivot point of $0.3122 and then the level of $0.3214 for the daily R1. Below are the lower band of the daily Bollinger Bands at $0.2791 and the level of $0.2730 for the daily EMA200, which together form a broader support area. Until the daily resistance level is re-conquered, any hourly rebound can only be considered a partial recovery.
However, the most likely false signal would be when the price briefly recovers to the hourly pivot point only to fall back before breaking through the hourly R1 level. Since these levels are all within the 0.004544 USD range of the hourly ATR, there is enough room for the price to trigger a signal, but it may not result in a sustained direction. A bearish breakout could also fail because the negative momentum at the hourly level is beginning to ease. A closing confirmation can reduce ambiguity, but it cannot completely eliminate this risk.
RSI remains weak, while MACD only provides partial relief.
RSI distinguishes between small-scale executionary rebounds and daily-level corrections
The daily chart RSI is moving downward, at 42.7, which fits a neutral but weak daily environment, rather than a confirmed bullish reversal. The hourly chart RSI shows 30.0, classified as flat; its underlying readings are still slightly above the oversold threshold. There is obvious selling pressure, but an oversold reversal has not yet been confirmed.
In 15 minutes, RSI rose to 46.8. This brought some improvement at the execution level for STX, but the momentum is still below the central axis. The contradiction is clear: the shortest-term cycle is improving, yet there is no corresponding strength in the daily and hourly charts.
The MACD on the hourly chart shows a relief, which conflicts with the deterioration on the daily chart.
The daily MACD bar chart has fallen below the zero axis and continues to decline, weakening the argument for a sustained rebound. The hourly bar chart is still negative, but the range is narrowing, indicating that the downward momentum is weakening, rather than a shift to a bullish trend having already occurred.
On the 15-minute chart, the bar chart shows a positive trend and is classified as stable. Overall, these readings suggest the possibility of a short-term rebound, but they are not sufficient to offset the deterioration at the daily time frame. The alleviation of momentum and the repair of structures are not the same thing.
The daily line EMA arrangement is still in place, but the short-term structure is relatively weak.
The candlestick data for Binance shows that the price is below the daily level of $0.3275 for EMA20 and $0.3254 for EMA50, but it is still higher than the daily level of EMA200. The daily moving averages remain in a bullish arrangement. This is also the strongest reason for maintaining a neutral outlook on the main daily chart, rather than directly concluding it as a completely bearish structure: although the price is weak, it has not yet broken this arrangement.
At the same time, the hourly prices are below EMA20 at $0.3000, below EMA50 at $0.3077, and below EMA200 at $0.3201, showing a bearish pattern. The 15-minute chart also shows prices below EMA20 at $0.2922, below EMA50 at $0.2962, and below EMA200 at $0.3074, indicating a bearish trend as well. Therefore, these lower time frames weaken the daily chart structure rather than confirming it.
The middle band of the daily Bollinger Bands is at $0.3174, which is higher than the current price, and the upper band is at $0.3557. The price is located in the lower half of this range, with the daily ATR at $0.02992. On the hourly chart, the middle band of the Bollinger Bands is at $0.3007, and the upper band is at $0.3143. A return to these middle bands could still constitute a corrective framework, but it is not yet a established trend.
Bitcoin staking news contrasts with the Stacks DEX event
However, the trading volume of DEX on the Stacks blockchain reached $591,881.00 in the past 24 hours. There was a clear differentiation in activities across various platforms: the trading volume of Bitflow decreased by 33.66% in one day, while that of ALEX increased by 178.27%, and Velar AMM increased by 908.33%. Nevertheless, the 7-day changes for all three were negative. Therefore, the growth of individual platforms on a single day does not indicate a widespread increase in overall activity. These figures represent the blockchain trading volume, not the trading volume, transaction fees, or revenue of STX itself.
Fear sentiment indicates that there is almost no confirmation of a broad risk appetite.
Frequently Asked Questions
Is $0.2915 the completed daily closing price?
No. This is the current real-time price of Binance, which corresponds to the un-closed candlestick. The indicator uses completed candlesticks; therefore, the real-time quote and the indicator reading represent different observation points in time.
Can the enhancement of individual DEX platform activities confirm a strengthening demand for STX?
Not possible. The data provided covers the transaction activities on the blockchain platforms, not the specific requirements of STX. Moreover, the daily variations across different platforms are not consistent.
This article was generated with the assistance of artificial intelligence and has been reviewed by an editorial team.
Lorenzo Marcek is a financial journalist and senior crypto market analyst, known for his clear, data-driven reporting on digital assets. With a background in economics and over a decade of experience covering global markets, he specializes in on-chain indicators, institutional adoption trends, and macroeconomic factors that influence crypto market volatility. His work combines investigative journalism with technical market insights, making him a trusted source for traders seeking solid and actionable analysis.